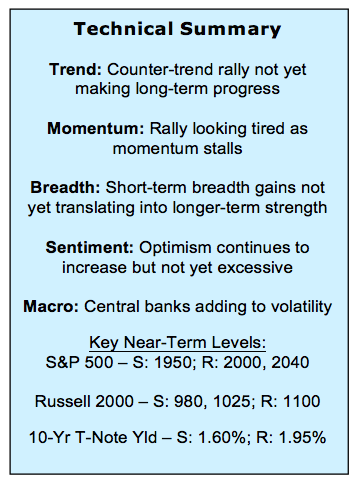
Here’s a look at some key stock market indicators, charts, and themes that we are watching.
This Week’s Stock Market Outlook:
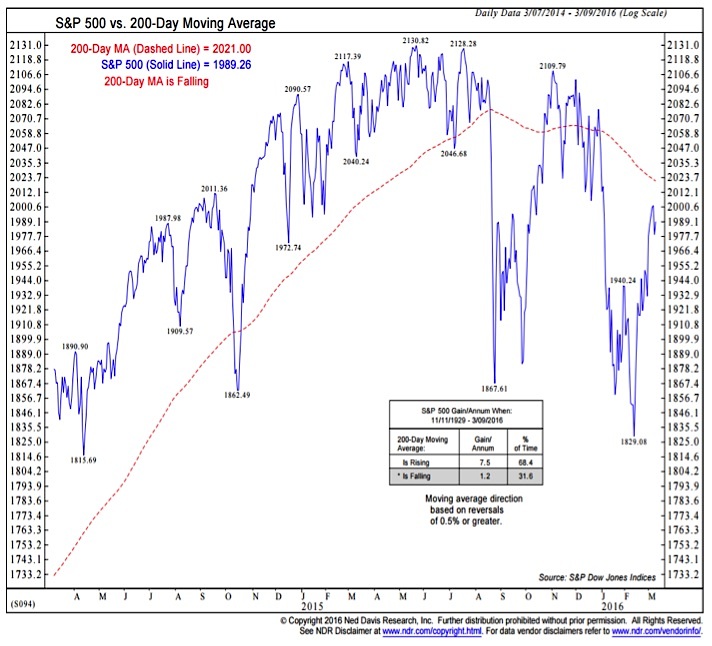
Longer-Term Trend Improvement Remains Elusive – With the ready availability of so many tools (in terms of data and indicators) it can be easy to forget some of the basics. History suggests that the SP 500 has struggled to sustain a rally when its 200-day average is falling. Despite the move off of the February lows, the 200-day average for the S&P 500 continues to move lower.
Rally Off Of February Lows Looks Tired – As impressive as the rally has been over the past month, there are still too many stocks in down-trends and it increasingly appears that the rally has started to run out of steam just shy of important resistance levels.
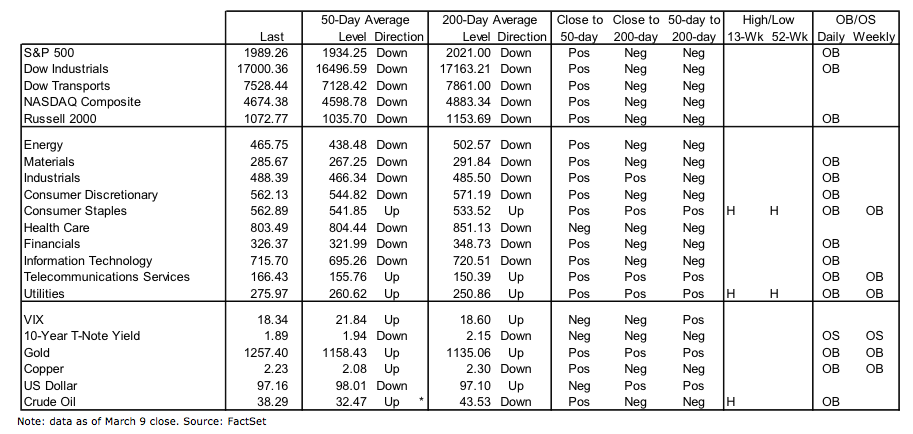
Sector-Level Leadership Remains Defensive – Our relative strength work continues to show Utilities, Consumer Staples and Telecom (all three of which are at or near new 52-week highs on an absolute basis) are leading the market. We have seen some improvement in Industrials, which is encouraging. Areas like the Broker/Dealer group and Biotech have failed to get back in gear after faltering in the second half of 2015. Their relative weakness remains a concern.
Stock Market Indicators – Indices & Sectors (click to enlarge)
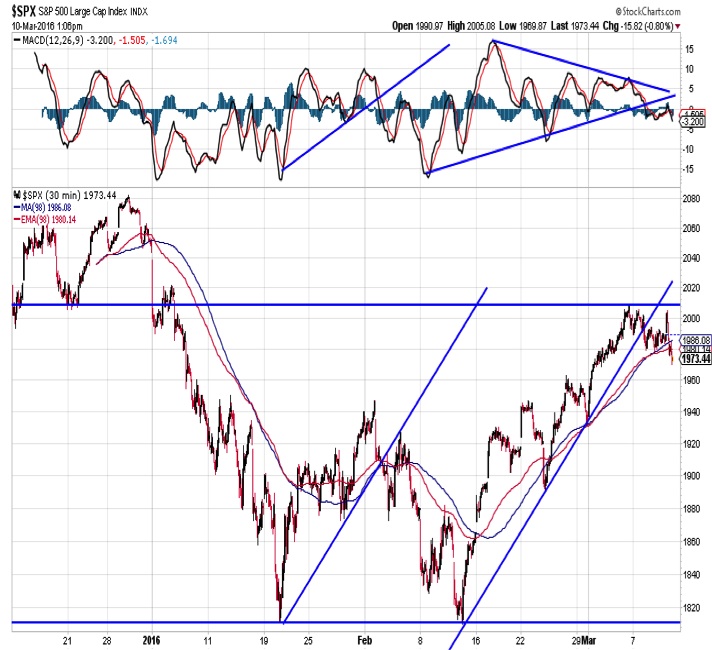
S&P 500 Index
More is not always better when it comes to looking at a chart. Sometimes the best approach is to clear away the noise and just focus at first on the longer-term trend. While the S&P 500 has moved sharply off of its February low, it remains below its 200-day average, which is falling. This is true for almost all of the domestic stock market indexes we track. The size of the rally is more indicative of the decline that preceded it rather than evidence of longer-term trend improvement at this point.
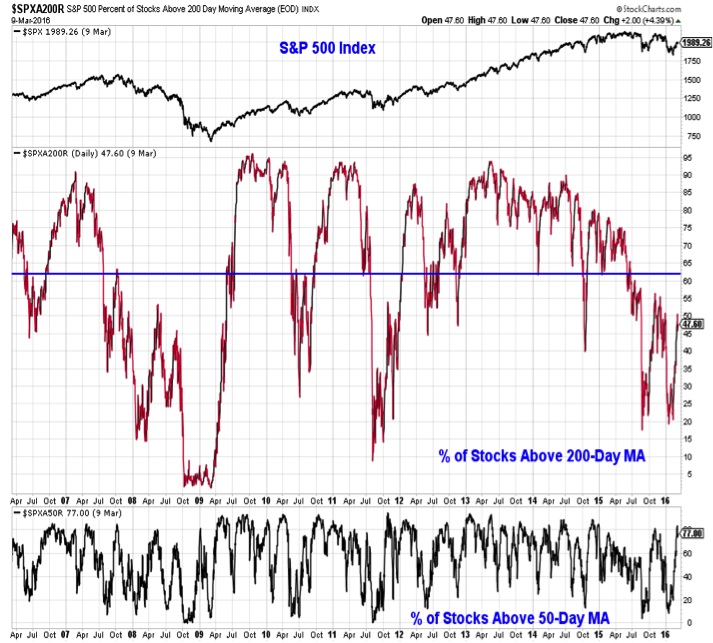
Another way to consider the longer-term trend is from the perspective of the number of stocks trading above their moving averages. While the percentage of stocks above their 50-day averages has moved toward 80%, the percent trading above their 200-day average is below 50%. In periods of sustained stock market strength, we consistently see more than 60% of stocks above their 200-day averages. We could be on our way to that, but we are not there yet.
Zooming in and looking at the rally off of the February low shows a trend that is getting tired and momentum that has stalled. It is too early to know whether the S&P 500 is going to work off its overbought condition through time or through price. Given the still-poor longer-term price trends, history would suggest the latter. A break below 1950 would seem to confirm this.
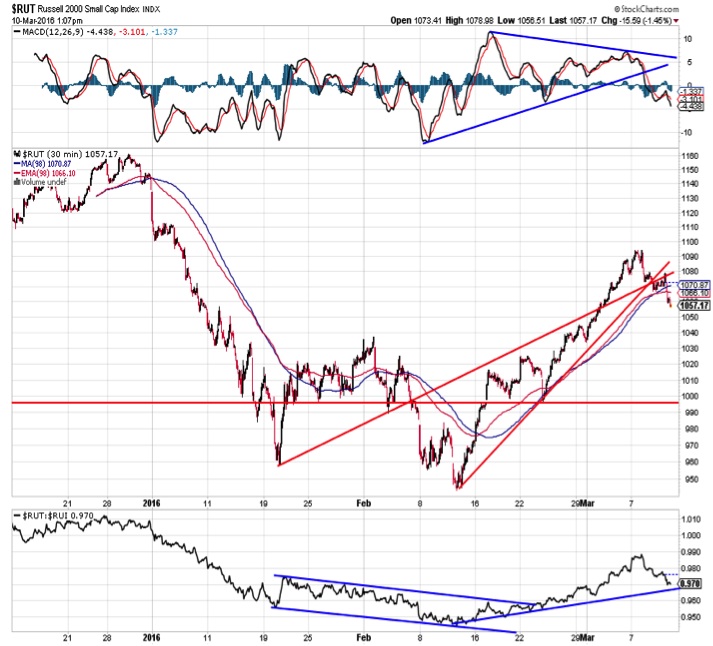
Russell 2000 Index
The bounce on the Russell 2000 has also seemingly run out of steam, and a period of consolidation could be ahead for small-caps as well. While small-caps have outperformed large-caps over the past month, that leadership is now being tested. If this is just a pause ahead of another sustained leg higher, relative small-cap leadership would be expected to persist. In other words, a break below the trend-line in the small-cap/large-cap ratio would strengthen the argument for an absolute price pullback as well.
continue reading on the next page…


