Where do I start? A great question. Nothing really has changed from last week. We’re still in a correction mode and Fridays are turning out to be nightmares for the stock market… and that’s been the case for several weeks now. Market sentiment is more bearish and even with no new lows in picture. This is a positive sign in my opinion. And notice that 1867 is still some ways off.
BUT, bears want it all.
And why not? Such is the environment with a ton of fear. Market Volatility, as measured by the VIX – as long as it stays > 20, is going to keep it that way. Of course we are entering October. And I believe market volatility is bound to be on the higher side. And did I hear recession? Really? With GDP being revised to 3.9 from 3.7, that is likely ruled out for now. Even so, the ball is on bears court. We’ll see if they can take it and push prices lower this week… that remains to be seen.
The charts for the indices are still pathetic and bearish looking. Biotechs were annihilated ($IBB $XBI $BIB) on Friday. The charts were in a stealth bear flag and just ran out of gas and went berserk lower. And all of this with 3rd Quarter Earnings not even in the picture (which often tends to be a crapshoot). Don’t get me wrong here.
Overall the path of least resistance for the stock market is lower and September normally tends to end lower. Seasonality wise, the 3 weeks from the September OPEX (hat tip: @RyanDetrick).
I’ve never seen so much bearishness on Stocktwits. The consensus I see among traders or investors is that the indices and/or equities will fall more and losses will continue to mount. The risk reward for the longs is pathetic. Agree and that’s not surprising one bit. Well again remember that are still trading above the lows and nothing goes straight down. What if the August 24th stock market lows were an extreme move and all we do is just meander lower near it and not take that out? A possibility – right?
I always like to be a contrarian, not foolishly but with some study behind the scenes. If you believe that we are following a 2011 type correction, then on the weekly chart of $SPY there are some remarkable similarities to now and then. I will say that the correlation is close. Here’s a chart that Jay Strauss shared in Stocktwits 2011 vs 2015 (Thank you @JayStrauss for posting it).
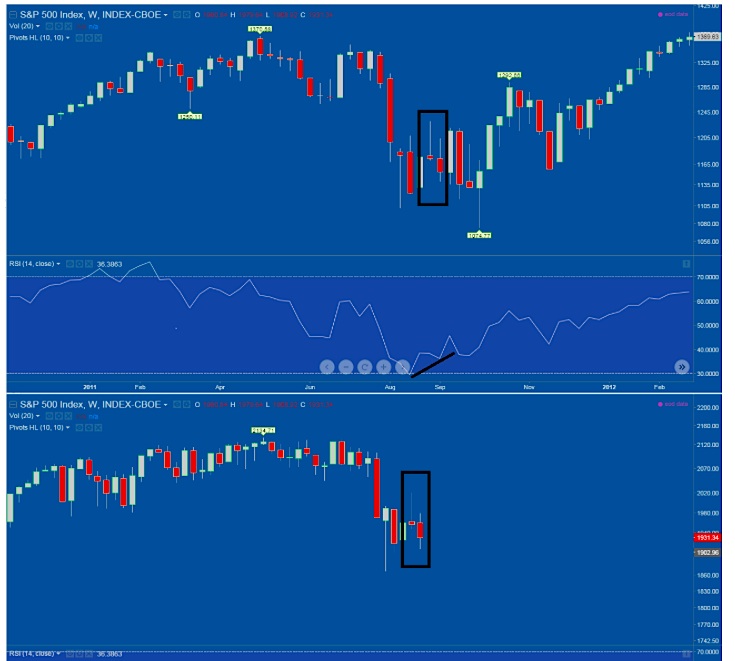
Again open mind – if this doesn’t happen then we possibly go lower as all the charts look better lower.
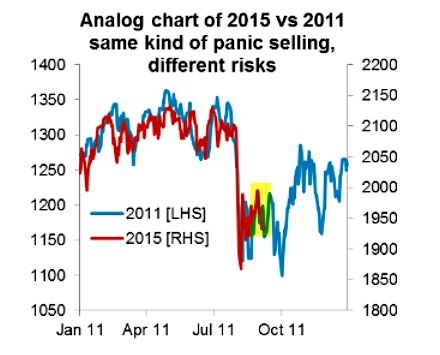
Here’s another chart from Callum Thomas (Callum_Thomas) that got me looking into it more deeply. Here too shows the possibility of a bounce next week – more bullish than anything.
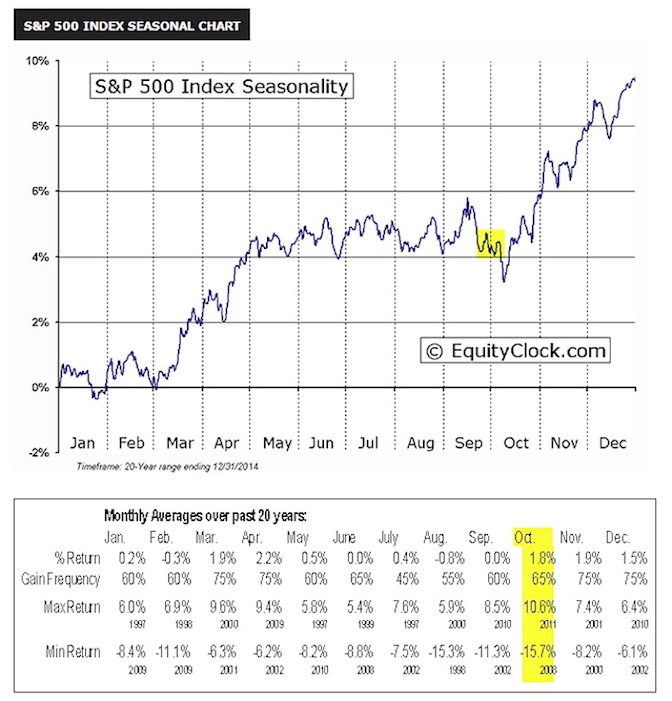
Also look at Equity Clock’s seasonality chart. Ends September possibly softly but bounces later on the 1st week of October before the next real leg lower. Note that these are 20 year Monthly Averages.
Before I delve into the market breadth indicators, I wanted to quickly point out something that I noticed in Twitter and Stocktwits. There were quite a few posts that I read stating that the Government Shutdown as being a very bearish event.
continue reading on the next page…


