June 17 Stock Market Outlook and Technical Review
Here’s a look at some key stock market indicators and emerging themes that we are watching:
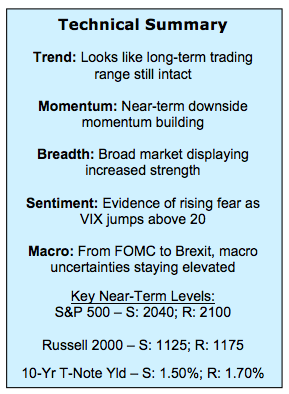
Rally Stalls, but U.S. Continues to Lead – The latest attempt by the S&P 500 to break through resistance that has capped rallies for over a year now has faltered and a modest negative momentum divergence has emerged. Relative to international stocks, however, the U.S. stock market remains in a leadership position and the up-trend may be accelerating.
Breadth Trends Remain Supportive – In contrast to previous attempts to get through resistance on the S&P 500, market breadth now is turning more supportive for stocks. The number of issues making new highs is expanding and (perhaps even more importantly) the number making new lows has remained muted. The percentage of industry groups in up-trends is expanding, a distinct difference from broad market action in 2015.
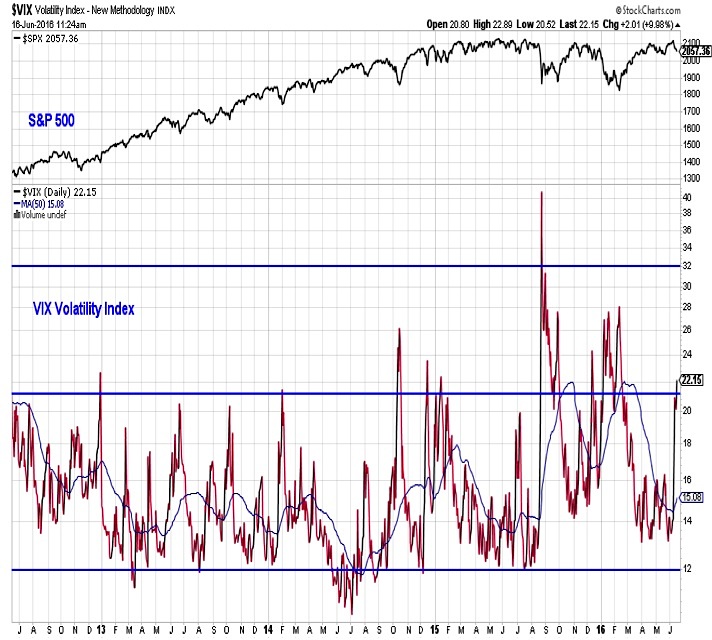
Some Evidence of Fear, but Cash Still Scarce – The VIX Volatility Index has risen from below 13 last week to above 21 this week. Investors have turned fearful as macro-related noise has increased. While this may capture a dour mood of investors, we see little evidence of this translating to action in terms of actual elevated cash exposure.
Stock Market Indicators – Indices & Sectors (click to enlarge)
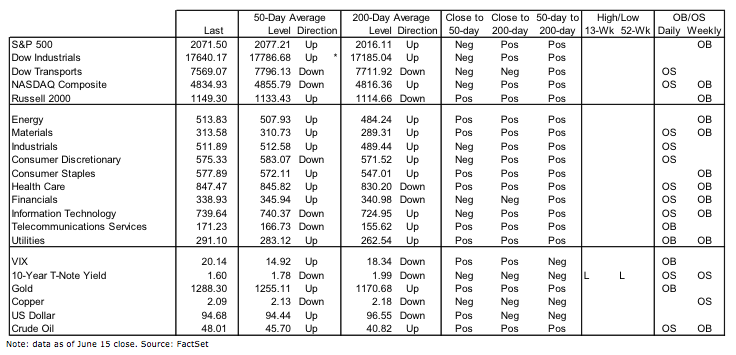
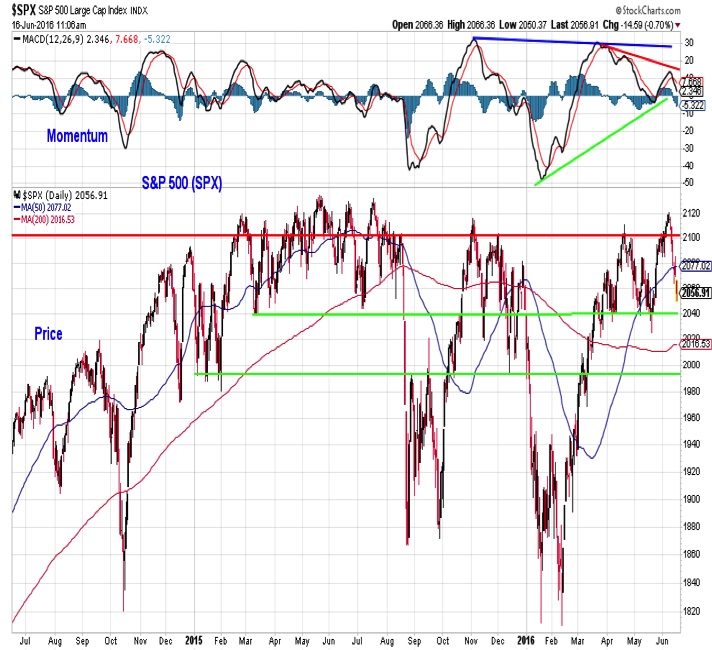
S&P 500 Index
The S&P 500 again probed above 2100, but as in previous tests since 2015, it was unable to hold this level. As long as the 2040 level holds, a pattern of higher highs and higher lows will remain intact. A failure there could lead to a test of support below 2000. Working against stock market prices right now is that modest divergence between price and momentum (which has made a lower high).
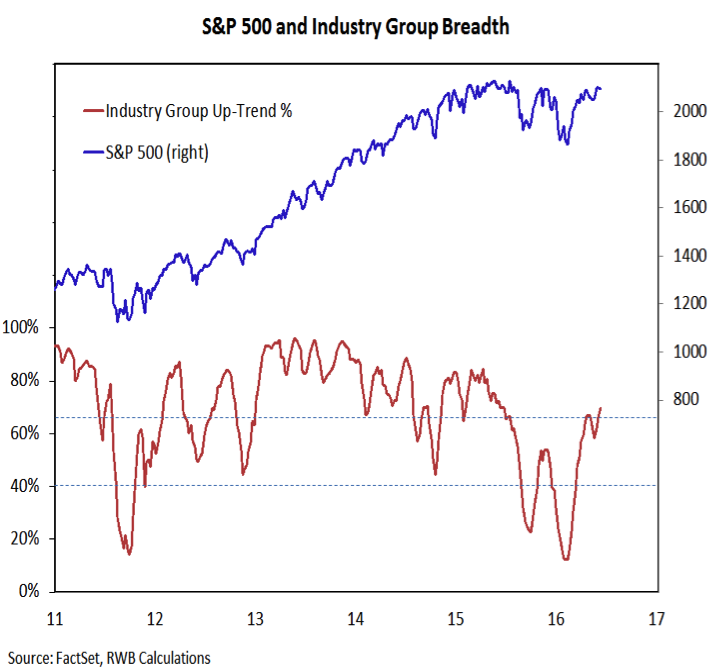
Broad market gains are accumulating to the point that market breadth is on the cusp of turning bullish. Looking beyond just the cumulative advance/decline lines there is evidence of even more substantial market breadth improvement. The number of issues making new highs is on the cusp of its highest level since 2014 and the number of issues making new lows has been muted on pullbacks. From an industry group perspective, the percentage of groups in up-trends (shown to the right) has broken its pattern of lower lows and lower highs, and has stayed robust even as the S&P 500 has struggled in recent weeks.
S&P 500 vs VIX Volatility Index
While the VIX can grind lower and stay low for extended periods of time, rapid spikes tend not to persist. The move like we have seen over the past week is consistent with investor fear (at least in the short term). This move in the VIX is echoed by the latest data from the AAII, which showed stock market bulls dropping to a three week low, but bears jumping by nearly 10 percentage points, rising to their highest level since February (17 weeks). In contrast, the Investors Intelligence survey shows bulls continue to outnumber bears by 2-to-1 among advisory services, and according to the NAAIM, active investment managers increased equity exposure last week.
continue reading on the next page…
")


