Here’s a look at some key stock market indicators, charts, and themes that we are watching.
This Week’s Stock Market Outlook:
Are We Through Resistance – Last week we were looking for confirmation, and this week we seem to getting it, at least from large-caps. The S&P 500 has moved into resistance near 2075, but a look at the equal-weighted S&P 500 shows that index has already broken out. Small-caps, on the other hand, still have more work to do.
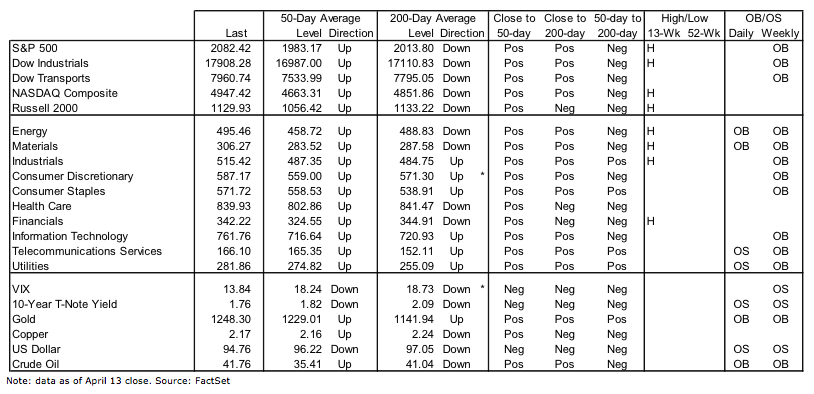
Breadth Getting Back in Gear – The broad market continues to chug along. The percent of issues trading above their 200-day average is in bullish territory (above 61%) and the percent of NASDAQ issues above their 50-day averages is at a level last seen coming off of the March 2009 lows. Sector-level trends have turned higher again (we highlighted the deterioration there as a potential caution flag last week).
Optimism Proves Fleeting – There is an ongoing debate about how loved or unloved this rally is. ETF and mutual fund flow data offer somewhat conflicting views. This week’s sentiment surveys, while not showing much more pessimism, certainly show a decline in optimism. On top of that, assets have not meaningfully rotated out of inverse ETFs and into leveraged long ETFs.
Stock Market Indicators – Indices & Sectors (click to enlarge)
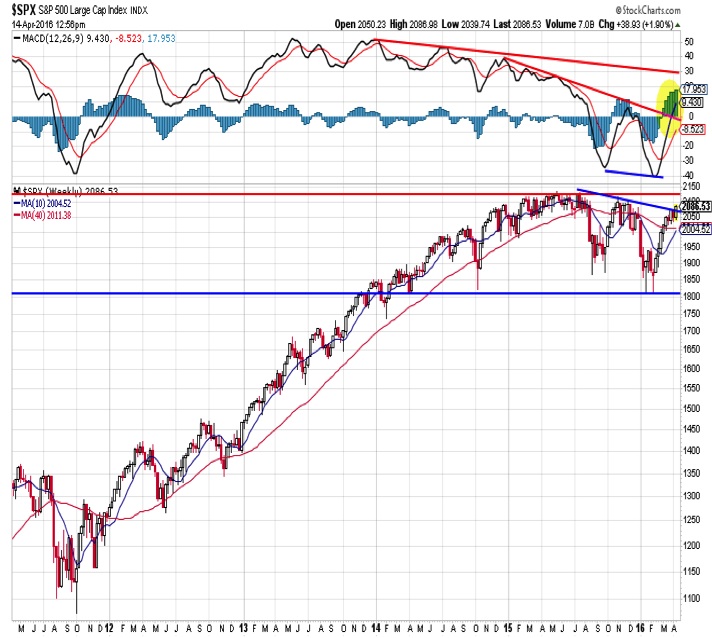
S&P 500 Index
The weekly chart of the S&P 500 shows it contending with down-trend resistance in the 2075-2080 range. A clean break above that level would argue for a test of the late 2015 highs in the 2110 to 2115 range. Supporting an upside price breakout is improving momentum. Much of our caution on the price rally off of the February lows has focused the lack of longer-term trend improvement. That now appears to be changing, with both price and momentum breaking out.
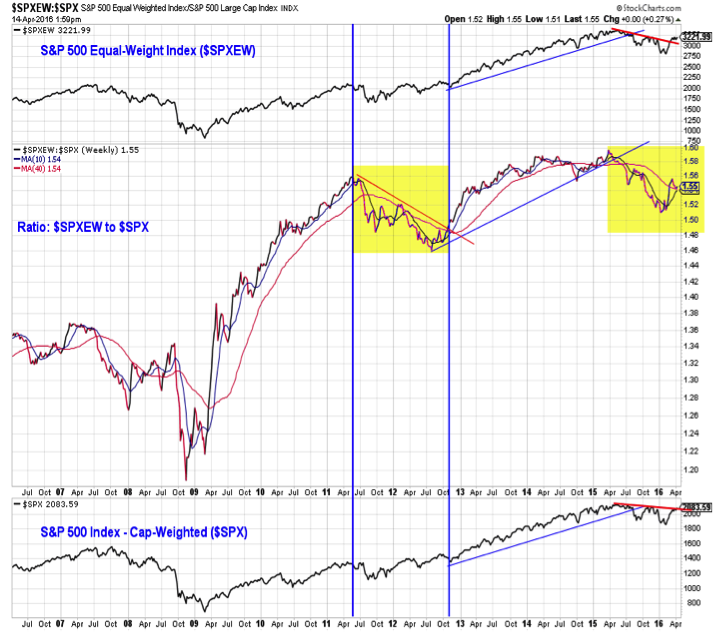
The S&P 500 is now working through resistance, but its equal-weight equivalent has already broken through resistance. The ratio between the S&P 500 Equal-Weight Index and the SP 500 itself has followed the pattern seen in 2011-12. In that case, the emergence of strength in the equal-weight index led to a sustained absolute up-trend in both indexes. We could be seeing something similar now, as the equal-weight index appears to have bottomed relative to the S&P 500.
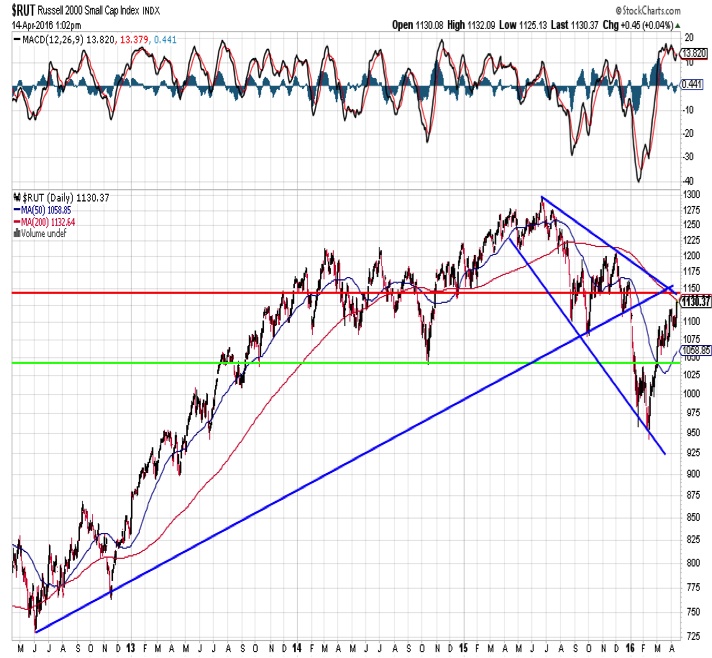
Russell 2000 Index
While equal-weighted, the $SPXEW is still composed of large-cap stocks. Small-cap stocks (represented by the Russell 2000) have had a more difficult time getting back in gear. The Russell 2000 remains underneath resistance that comes at the convergence of several trend lines and the 200-day average. While consolidating after breaking out above resistance can be a bullish set-up for another leg higher, consolidation beneath resistance can be indicative of a tired rally.
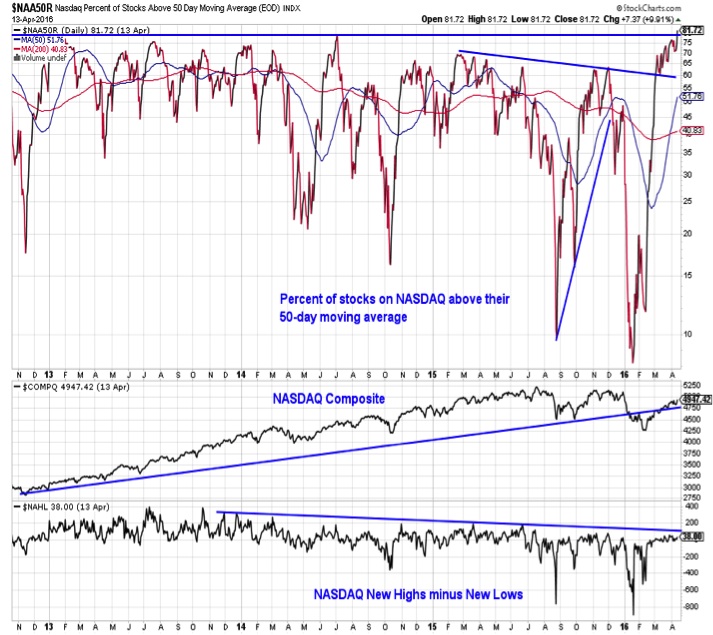
Nasdaq Composite
The number of issues making new highs on the NASDAQ continues to lag the improvement seen on the NYSE and has yet to break the pattern of lower highs. However, the NASDAQ Composite has rallied back above a long-term rising trend line, and the percentage of stocks trading above their 50-day average has now risen above 81%, the highest reading since May 2009.
continue reading on the next page…
 Rolling Over At Key Fibonacci Level?")


 Rolling Over At Key Fibonacci Level?")


