Last week saw an awe-inspiring move. Call it an oversold bounce or short covering rally – but it was a truly amazing week for the stock market. In the words of Jone Bon Jovi, many bears may now be “Living on a Prayer” near-term and some are probably pondering if/when/how to cover their shorts. This should be an interesting week.
Most of what I wrote mid-week and also in the blog post last week played out well. If you missed them, here they are:
“Pros and Cons of this rally” – 10/06/2015
For the upcoming week, with the shorter term technical indicators pointing to overbought conditions, we can see some consolidation along the way – perhaps at the 200 level on SPY where there is a ton of puts which can act as serious support for this week. There is not much overhead supply up until the 203-204 zone on the weekly chart of the S&P 500 ETF (SPY) and hence we may see that level before a meaningful pullback. Or stocks can consolidate around the 200 level and then go higher later on in the week but I think the former occurs first. The Volatility Index (VIX) had a spiker (lower) or what some call a ghost print towards 16, that will most certainly be hit at some point during the week.
Losing 200 on SPY could be a tad tricky as there are 2 spots we can move towards: 1. the 50 day simple moving average (SMA) retest 2. the rising 21 SMA. Both will be very meaningful if/when the indices take a break. I share this because I always try to share the various possibilities in order to stay prepared. Of course price trumps everything else.
Last week, all eyes were on the FOMC minutes. When a lot of investors were positioned for a drop in stocks, the reaction to the news was bought big time. The U.S. Economic Calendar for this week is equally important for the upcoming week. Retail Sales, MBA Mortgage Applications, PPI, CPI, Empire State Mfg Index and Consumer Sentiment are being reported. Of course, more Fed talk this week.
Alright, let’s see what the charts say. Market breadth indicators first and then the Volatility Index (VIX) and SPY.
BREADTH INDICATORS:
Market Breadth has improved to a vast extent and in fact some of them have started looking bullish and very constructive since the so called Double Bottom call by many. In my opinion, it was not a true Double Bottom but one that is close enough. Nonetheless, a ton of stocks are now above their 20 SMA and New Highs-New Lows has improved. The Put/Call ratio continues to decline further and that’s a buy signal. Normally, overbought breadth readings are not bad, especially if readings remain constructive and the stock market consolidates.
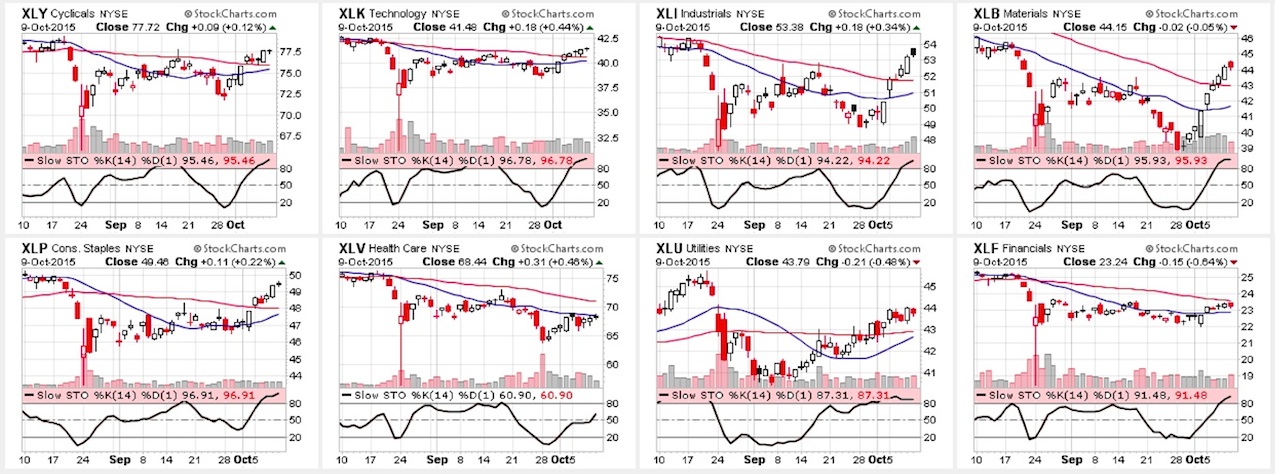
SECTOR PERFORMANCE: CANDLESTICK GLANCE:
Several sectors are overbought short-term. Overbought can be overboughter but I feel that “time” this can work off the overbought conditions. Perhaps a mini-pullback in stocks is possible this week but not much signs of it yet. click charts to enlarge
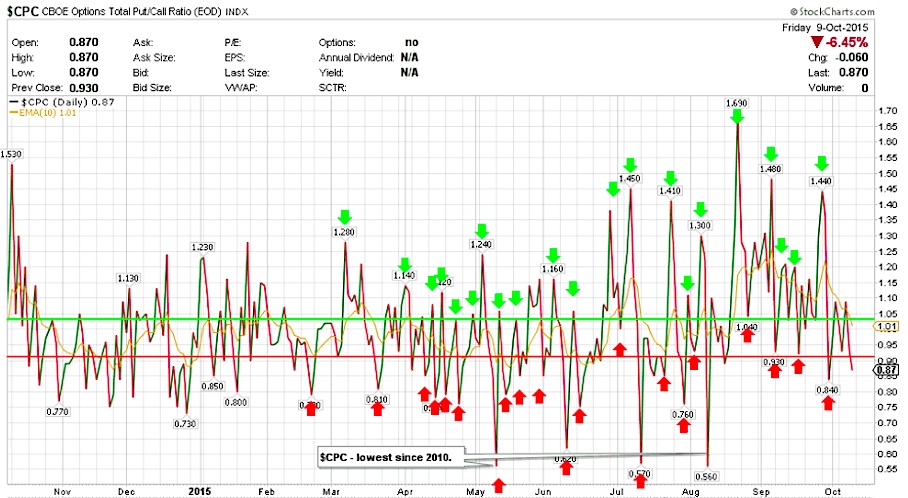
Put/Call Ratio – $CPC
The put/call ratio has been in the 1.20 – 0.80 range for another week. It can really go either way from here but if we see continuation in stocks, it has room to move lower.
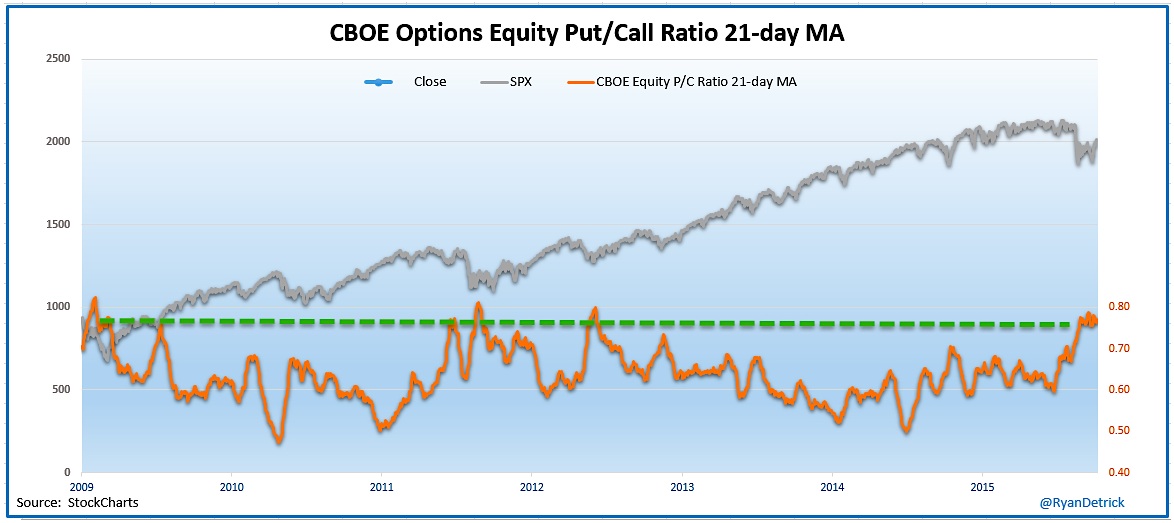
Below is an updated chart from Ryan Detrick (@RyanDetrick) — “CBOE equity put/call ratio remains stubbornly high. Bulls would love a rollover”.
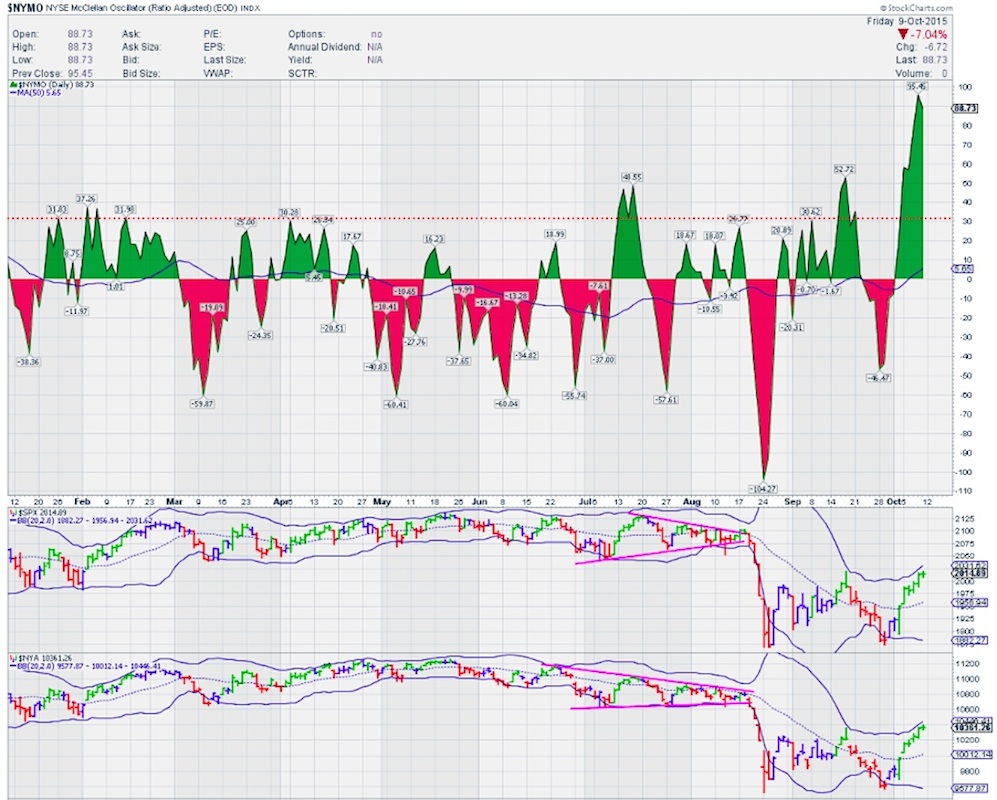
McClellan Oscillator – $NYMO
What do I say? $NYMO is hot and overbought. It hit 102 intraday Friday but ended at 88.73. It’s still overbought but some sideways action can bring this lower. Anything below 60 is not overbought but with the stock market indices this hot, it doesn’t seem that this wants to go lower. These are levels not seen before July/August 2011 or 2012. $NYSI continues higher after the bullish cross.
continue reading on the next page…

 Rolling Over At Key Fibonacci Level?")


