Another choppy week in the stock market has passed and we’re right back up against “THE WEEK” everyone is looking for. There has been money to be made on either side of the tape but with absolutely no real edge on either side – and that is the dilemma.
The Federal Reserve is going to be the trump card and they start their meeting on Wednesday. There is a strong belief that the Fed will not raise the interest rates. Frankly, I have no clue what they will or won’t do but any rate increase be it 12.5 or 25 BPS, should not hurt the economy if the GDP numbers are a true reflection of the economy. Note that financials thrive in a rising interest rate environment and can fuel a rally if need be (although that could be delayed). However, I feel that the Federal Reserve will do nothing.
Having said that, there has been some overall constructive action behind the scenes for stocks. Big moves yes, but on lower volume and not making new lows as of yet. The October 2014 stock market lows are still intact. Either way, I am leaning slightly bullish this week knowing very well that we are in a choppy, volatile market environment. And of course, I can be totally wrong and that is where Risk Management comes into play (and why it’s so important).
We are still in market correction mode. Market breadth has improved slightly but is still weak. So be nimble and cautious even if we get a rally in stocks. Don’t have to be a hero and wipe out your accounts. Cash is still a position for those uncomfortable trading in this environment.
Enough said, let’s see what the charts say. We’ll start with some market breadth indicators first and then look at equities via the S&P 500 ETF (SPY).
Market Breadth Readings:
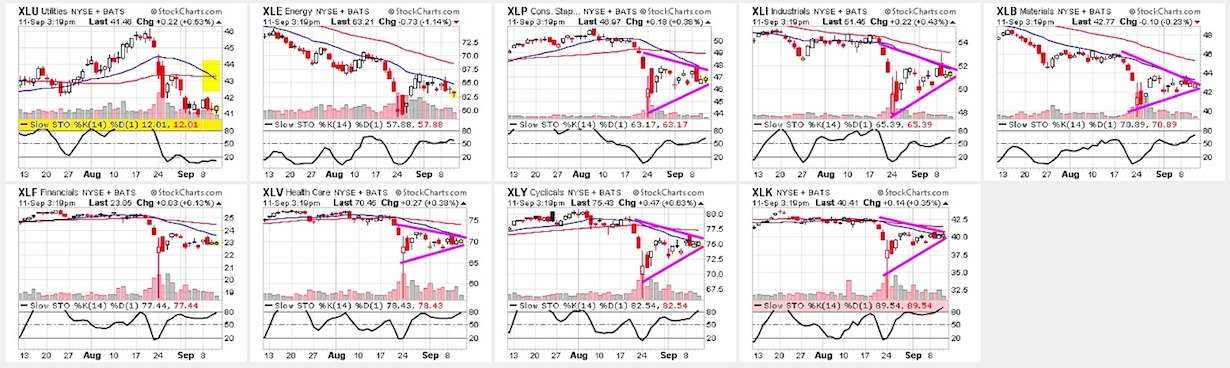
Sector Candlestick Glance: The Utilities Sector (XLU) is still oversold and the only oversold sector. Most of them are still in a triangle and could break either way. click to enlarge image
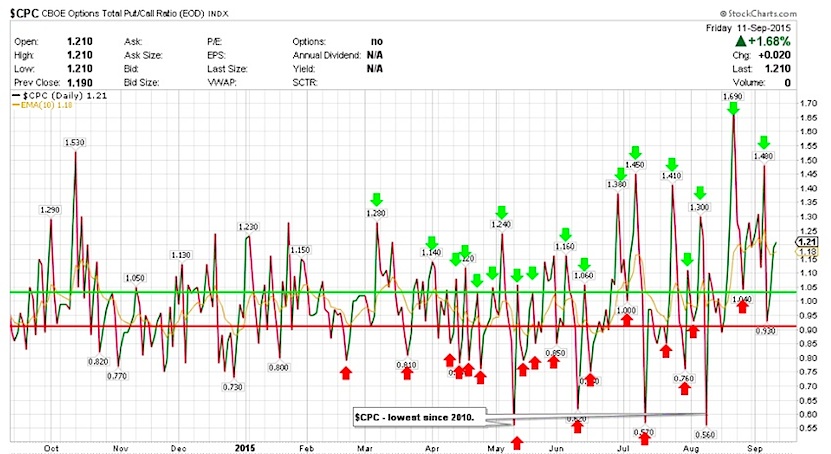
CPC – Put/Call Ratio: $CPC went lower towards 0.93 then ended the week at 1.21. With volatility elevated, this can go either way.
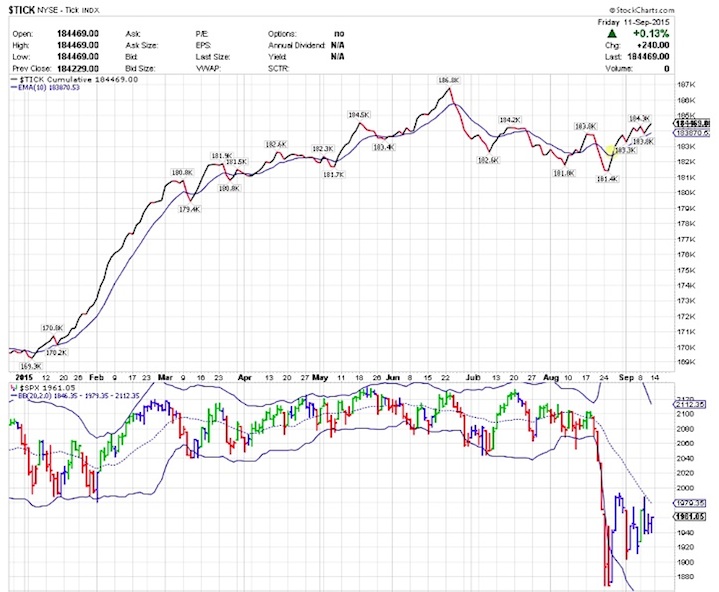
TICK: With some positive ticks, $TICK is rising above the 10 EMA. This sort of bodes well for higher prices but if we get more negative ticks, more chances for the price in indices to go much lower. Something to keep an eye on with Fed announcement this week. Note that $TRIN spiked again > 2 towards mid week but ended the week at 0.93.
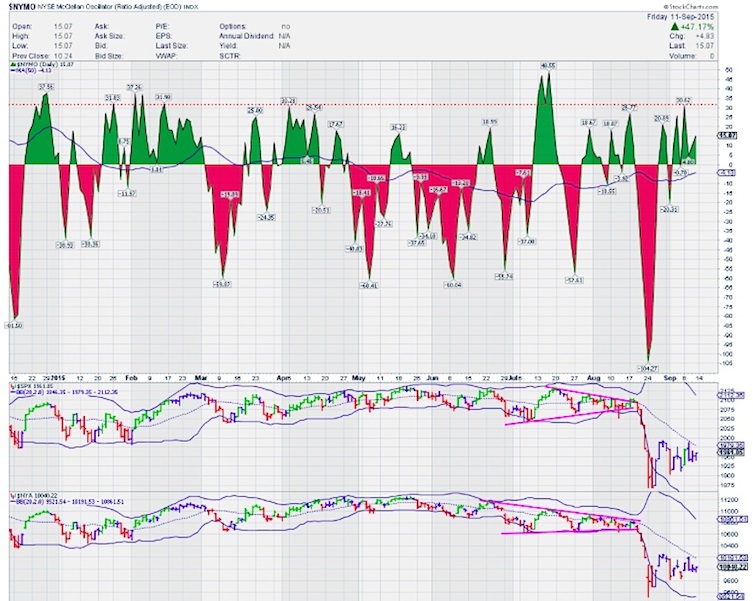
NYMO (McClellan Oscillator): $NYMO also chopped again this week to end on a positive note. Positive $NYMO bodes well for stockss on the higher side and negative on the lower (for newbies).
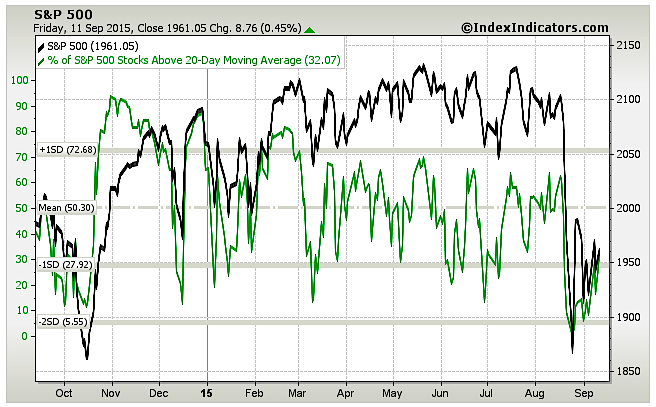
% of S&P Stocks Above 20-Day Moving Average – 32.07. This is a better reading from last week’s 8.57 but not a whole lot.
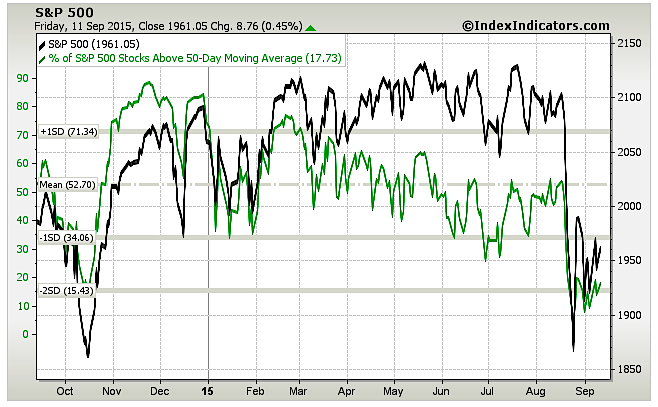
% of S&P Stocks Above 50-Day Moving Average – 17.73. This is a slight improvement here but not a whole lot.
more on the S&P 500 and the VIX on the next page


 Rolling Over At Key Fibonacci Level?")
