 The story of a leadership stock doesn’t begin or end with a story of its fundamental profile or how it broke out from a constructive base or continuation pattern. The story begins at how the stock acted at key moving averages and / or price support during pullbacks, particularly as the general market is attempting to bottom. If the technical foundation of the price structure is unsound, the probability of the trade being successful drops significantly. In my opinion, the weekly chart is the most effective time interval to evaluate the quality of support that the stock is demanding at key support levels. The weekly price and volume footprints offer an effective way to filter trade options and define entry criteria for finding market leaders.
The following are four annotated examples that offered a solid risk / reward opportunity as the market began to rebound from the October 15, 2014 lows. The weekly price and volume footprints were constructive and the trade entries were easy to define. Three of the four examples are printing new breakout highs at the time of publication and well ahead of new bull market highs for the general market.
Take note that I listed the average daily volume and float size to underscore that the examples are sufficiently liquid to take the trade around the stated trigger price. Low priced, low volume and small float stocks cannot be considered market leaders in my opinion. Note that the following charts are from MarketSmith Inc.
Celgene Corp. (CELG)
- Triggered on October 20, 2014 at $90.99.
- 16.1% return as of October 28, 2014 close.
- 16.5% return at October 28, 2014 breakout high.
Current Daily Trading Volume (50-day average) = 4.97 mln shares
Current Shares in Float = 791.5 mln shares

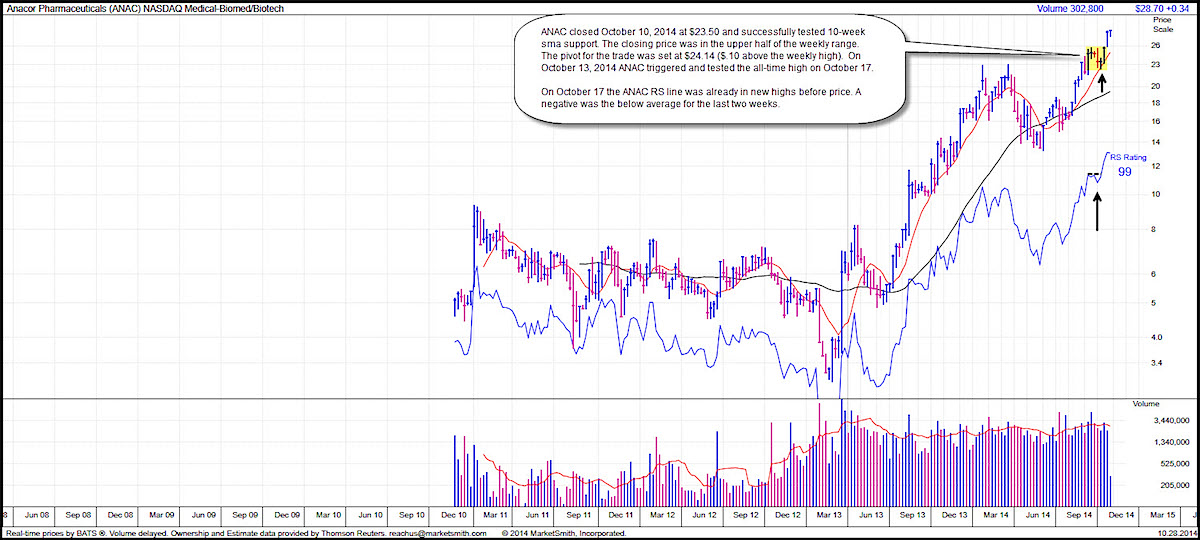
Anacor Pharmaceuticals (ANAC)
- Triggered on October 13, 2014 at $24.14.
- 19.1% return as of October 28, 2014 close.
- 20.6% return at October 28, 2014 breakout high.
Current Daily Trading Volume (50-day average) = 587,000 shares
Current Shares in Float = 31.9 mln shares
Akorn Inc. (AKRX)
- Triggered on October 20, 2014 at $38.07.
- 14.3% return as of October 28, 2014 close.
- 18.8% return at October 22, 2014 breakout high.
Current Daily Trading Volume (50-day average) = 1.28 mln shares
Current Shares in Float = 67.7 mln shares

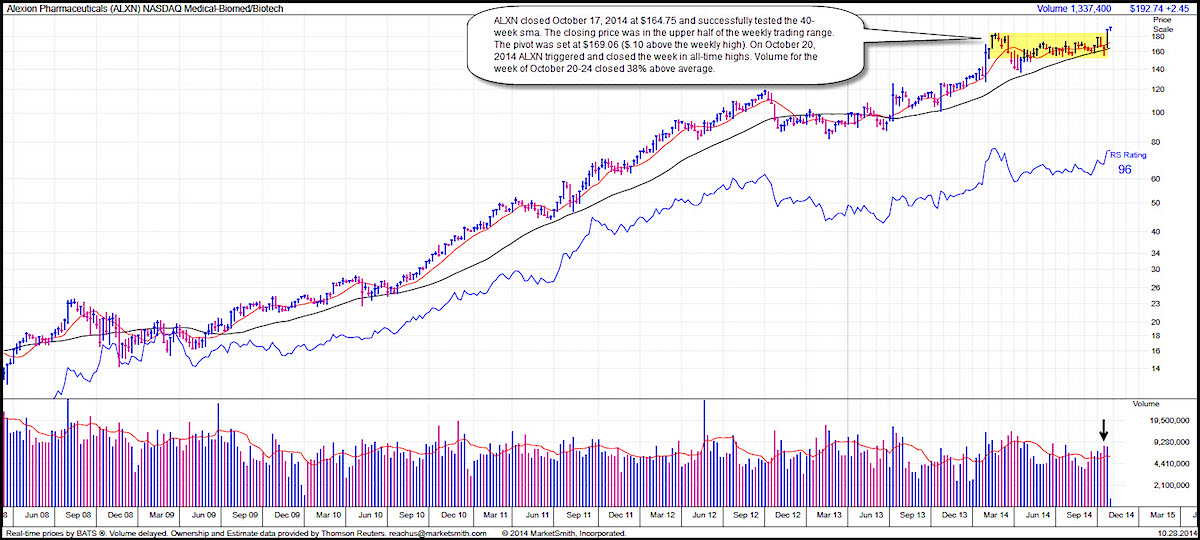
Alexion Pharmaceuticals (ALXN)
- Triggered on October 20, 2014 at $164.75.
- 16.6% return as of October 28, 2014 close.
- 17.6% at October 28, 2014 high.
Current Daily Trading Volume (50-day average) = 1.19 mln shares
Current Shares in Float = 191.9 mln shares
For your own work, take a look at GILD ISIS SNCR ILMN and MDVN.
As of the October 28, 2014 market close the author holds positions in AKRX ANAC CELG. 360° Virtual Advisor Pole Position model portfolio holds positions in ANAC and CELG. 360° Virtual Advisor closed the AKRX trade on October 22, 2014 for the Pole Position model portfolio.
Follow Sheldon on Twitter: @hertcapital
Any opinions expressed herein are solely those of the author, and do not in any way represent the views or opinions of any other person or entity.
 Rolling Over At Key Fibonacci Level?")


 Rolling Over At Key Fibonacci Level?")