The Big Picture:
Recognizing our biases in the context of what’s playing out is essential for long term success in the markets. For example, I recognize that I almost always believe stocks should decline. At the same time, I understand that historically they’ve moved higher. The entire investment industry is built on the notion that stocks always rise over time and, given enough time, that notion has been true. *It pains me to write that.*
I’ll be the first to admit that the stock market has staged an impressive short-term, short covering, likely government aided swing higher in recent weeks, but I’m not ready to give up the dream of a bear market this year. We do need to recognize that the short or intermediate term uptrend is starting to trickle into the higher timeframes. That behavior gives us reason to recognize the potential for a shift in direction. For now, any sort of shift is still only potential. And perhaps if we examine market volatility we can glean more insight. More on that in a minute.
On the longer term timeframes, stocks are still within a larger consolidation or distribution and it’s premature to get overly excited about the potential for the next bull market. On that same note, some (more optimistic) participants might say that we’re just in a consolidation within a primary uptrend. Now a look at market volatility trends.
Market Volatility:
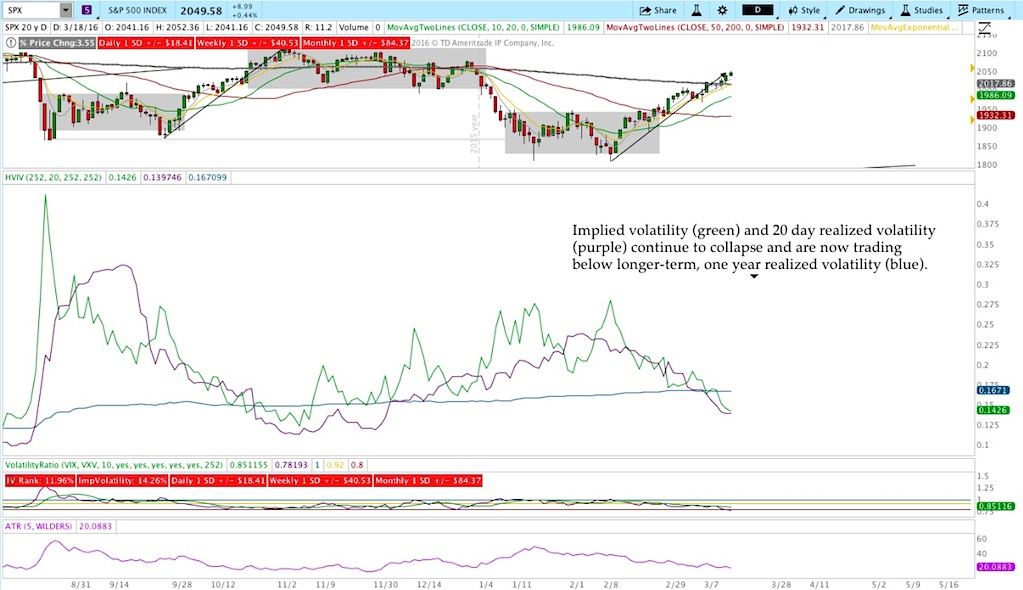
I’ve said it before, but volatility has been a great confirming indicator in 2016. Earlier this year we saw a divergence in the VIX:VXV ratio during the February low. Clearly that divergence confirmed the recent move higher. Around the same time, we also saw a collapse in implied volatility and a divergence in short term realized volatility. Additionally, volatility never suggested panic during the move lower in January. In other words, market volatility has been leading and getting it right.
As of the close on Friday, volatility is giving us some reasons for short term caution. We know that volatility, like the market, tends to move in waves. Periods of low market volatility tend to be followed by rising market volatility. At the same time, low volatility can persist for a surprisingly long period of time. The longer term trend in volatility (via 1 year realized) is still rising. If that trend continues, we can expect realized and implied volatility to rise in the near future. And that may affect stocks.
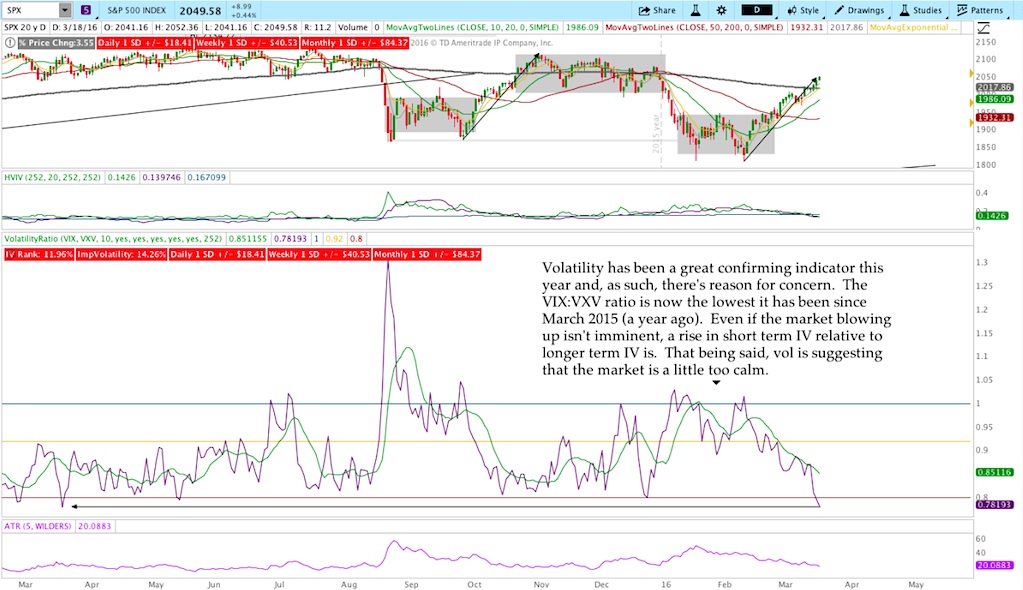
There’s so much complacency in options land that the VIX:VXV ratio is now back to early 2015 levels. My hunch is that people have been quick to sell premium with the move higher and now short term premium is depressed in price. In general, market volatility is suggesting a “healthy market.” However, price action in the market is far less clear. In the coming weeks and months we’ll see what happens, but volatility as an indicator is either setting up for a great market call or a great bull trap. Time will tell.
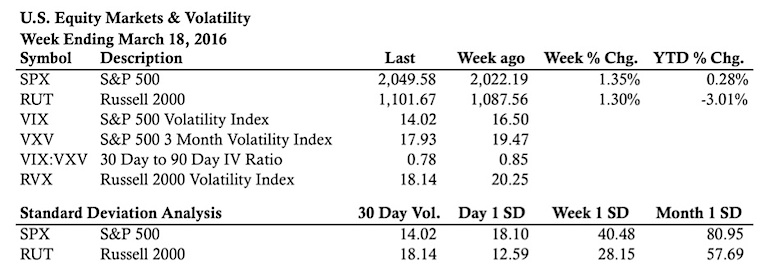
Market Performance Stats
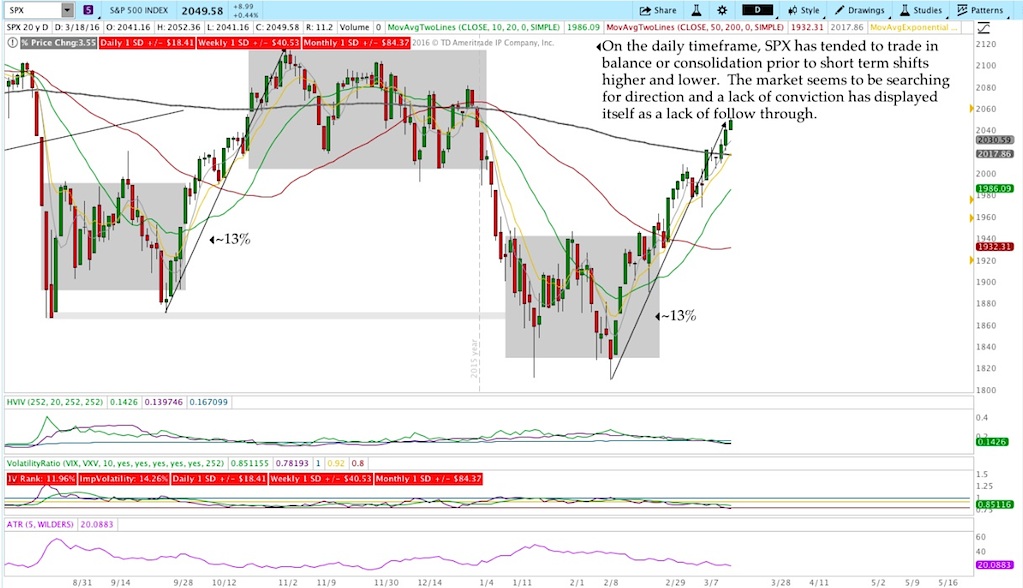
Levels of Interest: S&P 500 Index
In the levels of interest section, we’ll analyze the daily chart of $SPX to see what’s on the near-term horizon for the stock market.
Thanks for reading.
Further reading from Dan: “Gauging Sentiment For Stocks And Gold“
Twitter: @ThetaTrend
The author holds positions in mentioned securities at the time of publication. Any opinions expressed herein are solely those of the author, and do not in any way represent the views or opinions of any other person or entity.
 Rolling Over At Key Fibonacci Level?")


 Rolling Over At Key Fibonacci Level?")
