The Big Picture:
Move along everyone, there’s nothing to see here…
As someone who follows the markets constantly, it’s interesting to see how the Twitter stream, blog comments, and website traffic react to down moves and shifts in volatility. When the market is moving steadily lower, things seem to quiet down. It’s as though the Ostrich Effect comes into full force and people don’t want to look at or think about the markets. As the stock market slowed on the downside and found some stability this week, it seems like the effect softened as people were ready to acknowledge the damage done and look for opportunities.
Despite a solidly lower start to the year for stocks, market participants are calm. Even though the long only crowd is likely under pressure, we haven’t seen much in the way of panic. At the same time, the market environment seems different than the 2009-2015 period. The dip buyers are more cautious and, consequently, the market is pulling back more. From the deeper pullbacks we’re not seeing the same sharp reversals that we previously learned to expect. The change suggests that sentiment has shifted. Sharp reversals indicate that buyers don’t want to miss the next move higher and conviction in higher prices ahead. That conviction is questionable at best right now. And that shows up in price volatility, despite the lack of panic.
Going forward, it’s important to recognize that significant complacency can be the catalyst for significant change. The stock market generally has a buy side pressure, but it does go through periods of sharp decline. It also, however, goes through periods of grinding decline. The real take away is that we never know what environment we’ll receive until after the fact. At the same time, we need to recognize that the market environment over the past few years seems to have changed. Being blindly long stocks may or may not be the best strategy going forward.
As premium sellers, we need to be aware of the potential for risk on both sides of the market. More importantly, we need to recognize volatility has the potential to explode if the complacent get caught off guard. It does seem like some sort of bottom has been made on the move lower, but we haven’t seen the capitulation that tends to accompany larger declines. Even though the market went into the weekend strong, we can’t underestimate the potential for change.
Market Volatility:
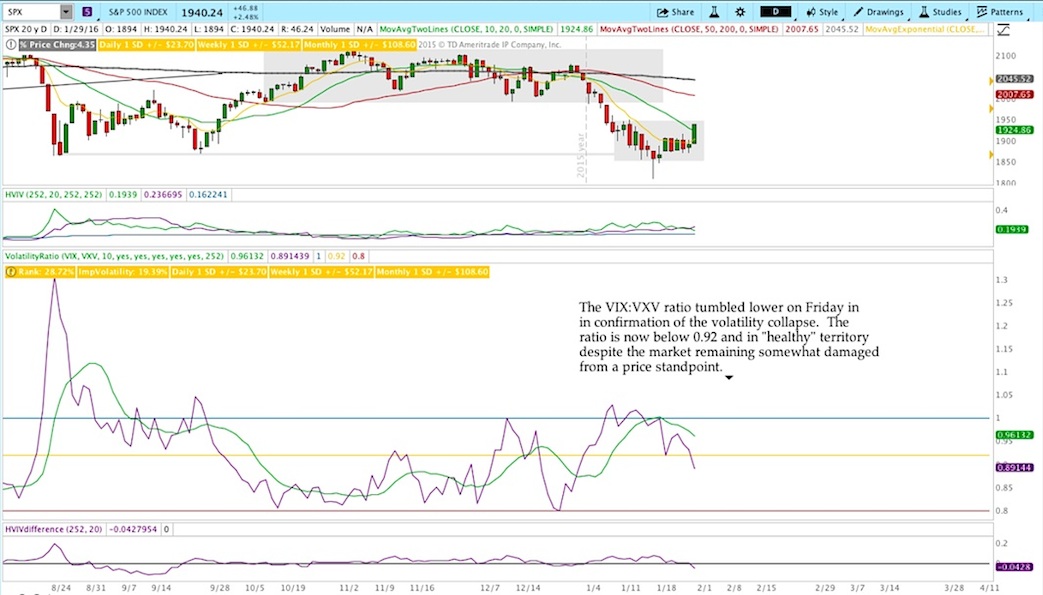
In every weekend market commentary this year, we’ve discussed a market divergence in volatility. What we’ve said is that despite the move lower in the market, volatility hasn’t panicked. The VIX:VXV ratio we use to confirm panic situations in the market was sluggish at best.
Note: Keep in mind that in true panic environments, the implied volatility of shorter dated options tends to rise more quickly and in excess of longer dated options. As a result, the VIX:VXV ratio that measures 30 day to 3 month implied volatility tends to increase above 1.00 when the market collapses lower.
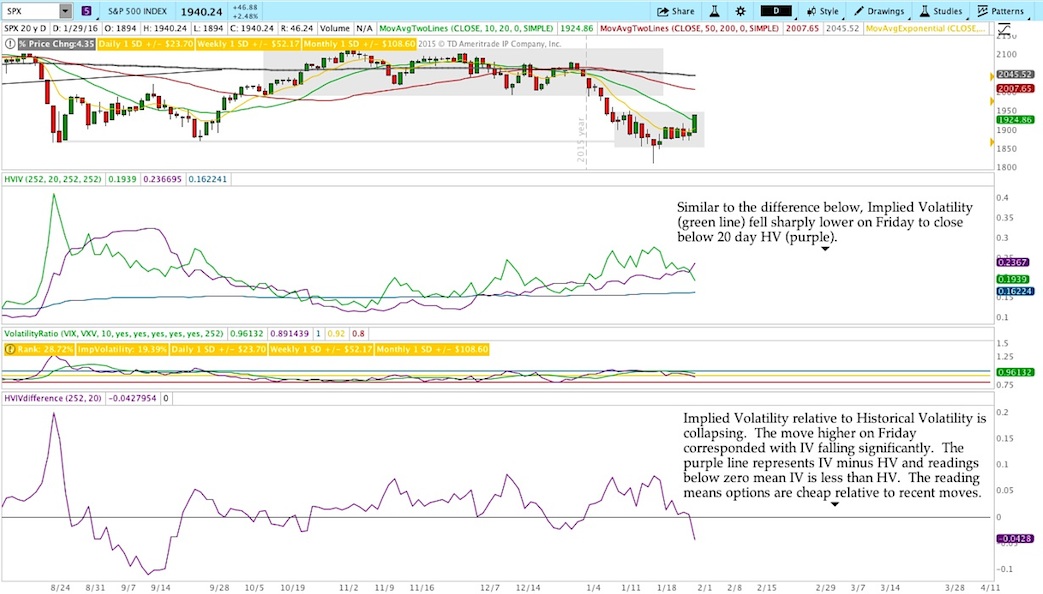
On Friday, we saw implied volatility collapse at the close and the VIX almost went into the weekend below 20. All measures of volatility are suggesting a significant amount of complacency and, at least for now, volatility has been correct. The images below show Implied Volatility relative to 20 day Historical Volatility. When Implied Volatility falls below 20 day Historical Volatility, it tends to correspond with stability and/or a move higher in the market. We’re not being predictive here, but the options market isn’t overly concerned about the bearish start to 2016.
All that being said, we need to put volatility in context. The market has been steadily sold this January and volatility has remained under control. That does not necessarily mean that the market will head higher. There are different types of bear markets and a grinding bear market where volatility remains largely under control is possible.
continue reading on the next page…


