Key Takeaway: First quarter GDP growth could fail to meet forecasts, but Q1 weakness in GDP is becoming a recurring theme. Other measures of the economy point to improving conditions or persistent strength. While our recent experience has been over-optimistic forecasts, such has not always been the case.
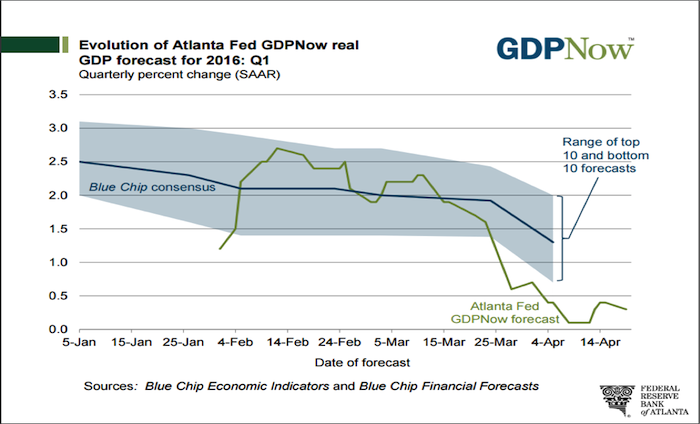
The initial look at Q1 GDP growth data is scheduled to be released on April 28. If the forecast model produced by the Atlanta Fed (which attempts to forecast GDP growth for the current quarter based on real-time data releases) is accurate, Q1 GDP growth slowed considerably in the first quarter of 2016.
The latest update to the GDPNow forecasts shows Q1 growth at 0.3% — below the consensus expectation of more than 1% growth and the 1.4% growth seen in the final quarter of 2015. The primary drivers of the expected slowdown in Q1 GDP growth are greater drag from overseas and inventories. While GDP may be the most comprehensive measure of the U.S. economy, it is not without weaknesses and trying to encapsulate the economy in just one figure is akin to relying on only one index or indicator to gauge the health of the stock market.
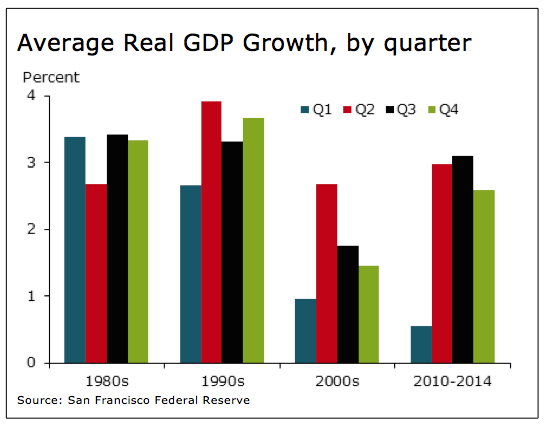
Data usually undergoes seasonal adjustment to smooth out quarter-to-quarter (or month-to-month) fluctuations. Without these adjustments, sequential changes in activity would probably be too noisy to be of any use. A persistent disparity in Q1 GDP growth versus the other three quarters has emerged over the past 15 years. In other words, weakness in reported growth for Q1 2016 may be as much about seasonal issues as it is about underlying weakness.
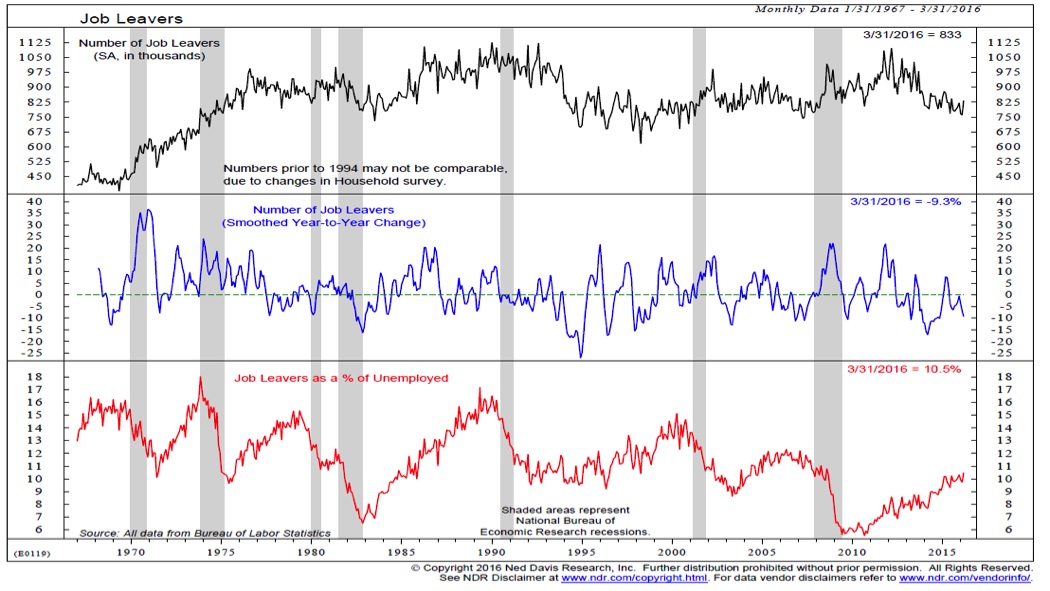
Looking beyond the GDP data, other indicators suggest stable or improving trends for the U.S. economy. While the number of job leavers has diminished on an absolute basis in recent months, job leavers relative to the total number of unemployed workers has continued to rise. This ratio has tended to lead the overall economy and now it is continuing to move higher. Initial jobless are the best real-time indicator of the health of the economy and they remain near multi-decade lows (indicating economic strength).
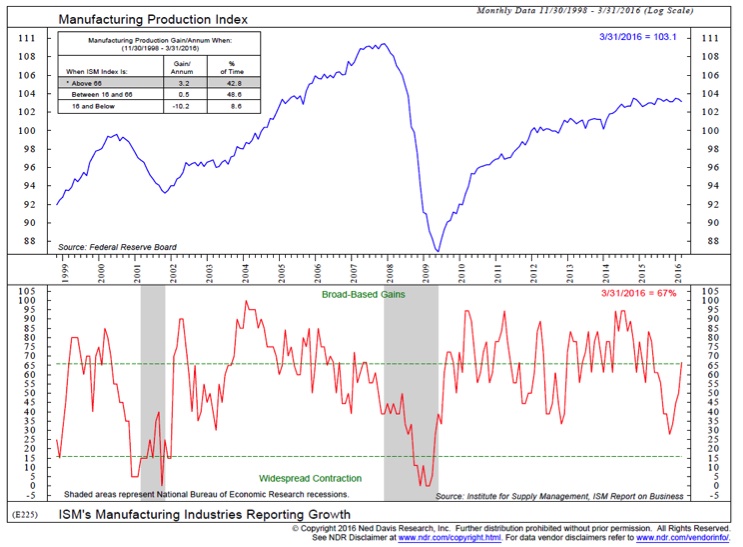
Even the much maligned manufacturing sector is seeing some evidence of improvement. The overall ISM purchasing managers index (PMI) crossed back above 50 in March (rising from 49.5 to 51.8). Perhaps even more impressive than the headline improvement has been the surge in the percentage of industries reporting growth. After bottoming below 30% in late 2015, now more than two-thirds of the industries are reporting growth. Broad strength like this tends to be bullish for the economy.
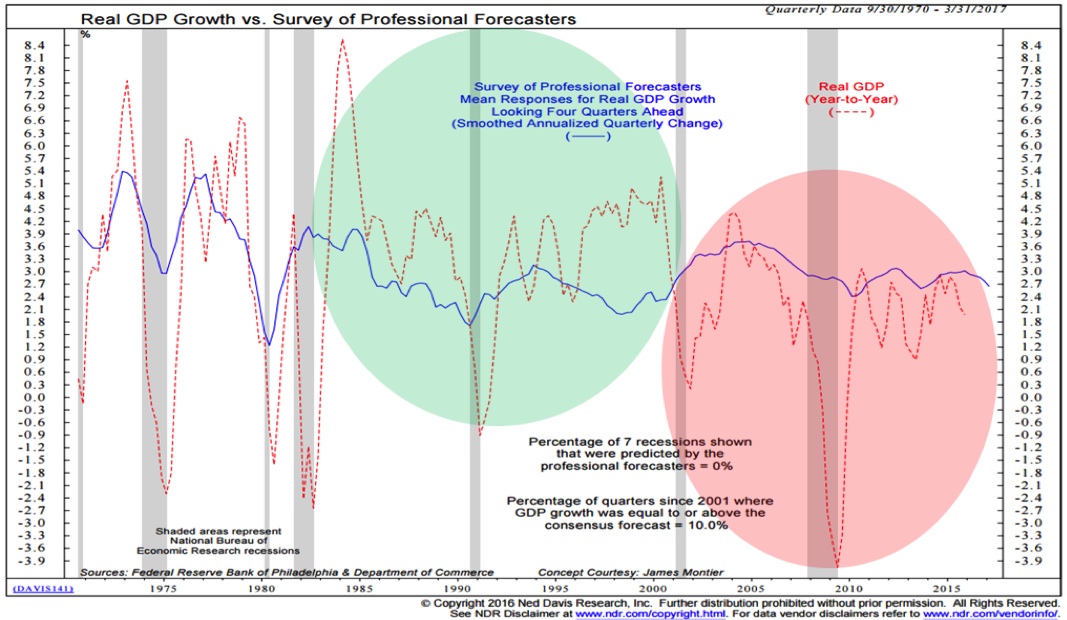
Over the past decade and a half, we have gotten somewhat used to growth forecasts that have been rosier than reality. That does not appear to have changed in the first quarter. Expectations, however, are starting to drift lower. It is important to remember that while forecasts have historically been wrong, that have not always erred on the side of optimism. Beginning in the early 1980s (following an era of diminishing productivity growth), the U.S economy saw a decade and a half of consistently better-than-expected growth. We may be on the cusp of that again.
Thanks for reading.
Further Reading: Broad Market Leading Stocks Higher In April
Twitter: @WillieDelwiche
Any opinions expressed herein are solely those of the author, and do not in any way represent the views or opinions of any other person or entity.


