The Volatility Index (VIX) is followed by most active investors and traders as a way of understanding the market’s sentiment toward stocks. It’s often referred to as the “Fear Index”. When it is really low, it signals complacency and sends a VIX warning to stocks. When it is high, it indicates fear in the market and the potential for a near-term momentum bottom in stocks.
Currently, market volatility is clocking in around 15 and resting a few points above its 2016 lows. So did the early action in 2016 send another VIX warning to stocks?
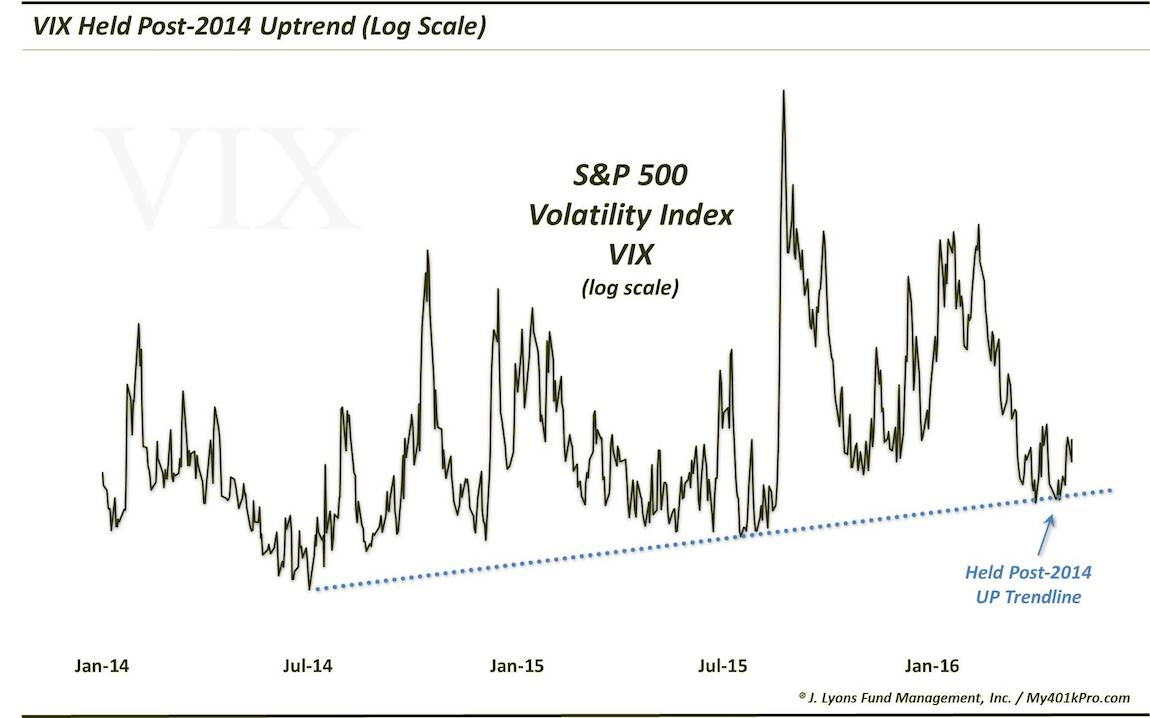
Below is a chart looking at the trend of the Volatility Index, preceded by some bullet points about the VIX price action:
- The S&P 500 Volatility Index (VIX) formed a bull market cycle low in July 2014.
- Since then, the VIX has been forming a series of higher lows. Using a log scale, the lows from summer 2014, summer 2015 and this past month form a well-defined Up trendline.
- In previous cycles of varying degree, the VIX has bottomed prior to tops in the stock market (S&P 500). Thus, stock bulls would be better served if the VIX could break its uptrend line and make a run at its 2014 cycle lows.
VIX Volatility Index Chart
Keep an eye on the VIX trend line. Thanks for reading and have a great weekend.
More from Dana: “Smart Money” Gets Bearish Silver Futures In Size
Twitter: @JLyonsFundMgmt
Any opinions expressed herein are solely those of the author, and do not in any way represent the views or opinions of any other person or entity.


")

 Rolling Over At Key Fibonacci Level?")

