The VXX Short-Term Volatility Futures ETF has been much maligned since its launch and one glance at the chart below shows why – it’s a poor way to hedge an equity portfolio. Despite the continued underperformance and value erosion (due largely to the cost of rolling front-month VIX futures), it remains one of the most liquid and highly traded volatility assets by both institutional and retail traders.
VXX Weekly Chart
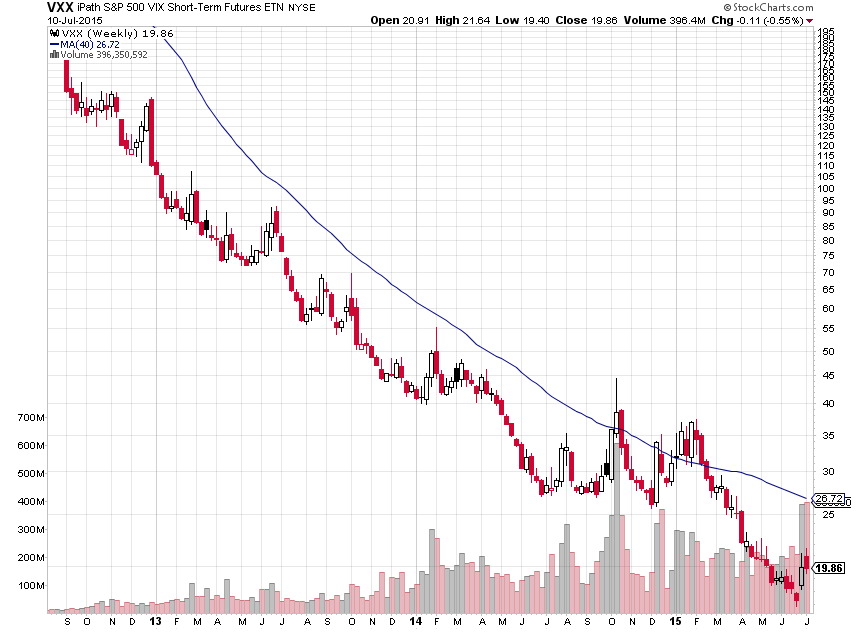
If the prospect of buying an asset that has had a -60% annualized return since inception doesn’t appeal to you (and it certainly should not), then how can the VXX be of any help to a trader navigating volatile waters?
We can take advantage of implied volatility’s mean reverting nature. In layman’s terms, it spikes when the market gets fearful and then drops when the panic subsides. In the case of the bull market that we’ve been enjoying since March 2009, these VXX spikes have been relatively short-lived.
VXX vs S&P 500 ETF (SPY) Daily Chart – RSI Buy Signals?
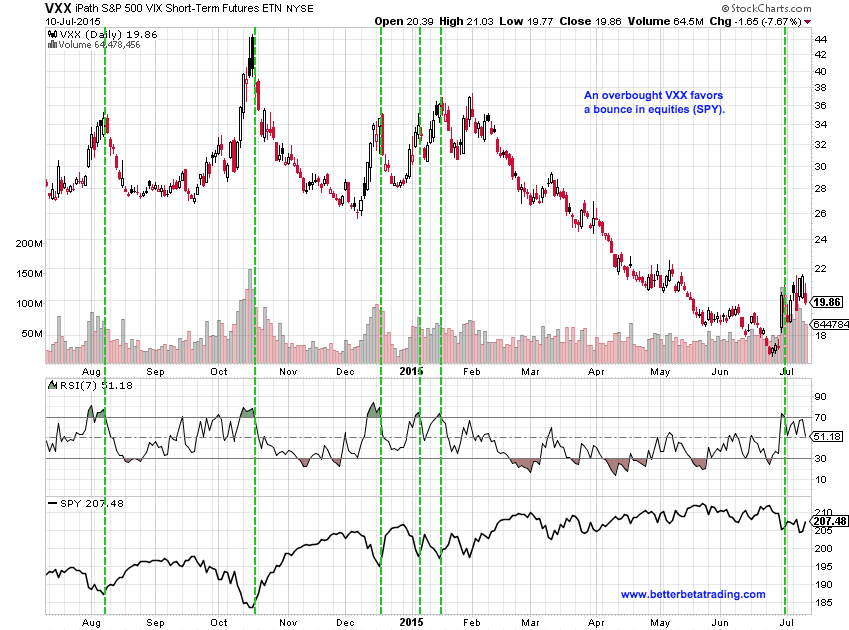
By using a simple measure of overbought like Wilder’s Relative Strength Index (RSI), we can wait for the VXX to rise above 70 and then drop back below 70, signaling the all clear to go long the SPY. This approach is robust enough to work with various RSI daily look back periods – from 5 to the traditional 14 – and across a range of holding periods. Some brief stats from a very bootstrap backtest:
Criteria: when the VXX RSI is above 70 on the previous trading day and then drops below 70, go long SPY at the close. Hold for designated numbers of days before closing the SPY long position at the market close.
SPY holding periods reviewed: 3, 5, 10, 14 and 30 days.
RSI look back settings (days) reviewed: 5, 7, 9, 14.
Period of time in sample: 1/30/09 (VXX inception) through 3/1/15
Overall: Every RSI setting across every holding period was profitable. The profit factors ranged from 1.35 all the way up to 10.25. The win ratios ranged from 54% to 83% with most ratios clustered around 65%. All but two of the RSI/holding period combinations had higher average wins than average losses.
The 14 day RSI setting had the fewest number of trades, averaging 10-15 trades during the period while the lower RSI settings saw upwards of 70 trades.
Overall, a very promising start to using the VXX and VXX spikes to take quantitatively contrarian position.
A few caveats:
This is in no way a trading system. It is merely an observation, albeit backed up by some spreadsheet magic, that suggests that a trader can benefit from using VXX spikes as buy signals for the SPY. Much more work would need to be done to make this a viable system (stop loss settings, position sizing, additional filters, etc). It’s a good place to start.
It is worth noting that while the VXX spikes are great for triggering a long SPY position, the inverse is not true. The VXX can remain deeply oversold for long periods of time (note the red in the RSI indicator) without a pullback in the SPY.
Have a great week and thanks for reading.
The author does not have a position in the mentioned securities. Any opinions expressed herein are solely those of the author, and do not in any way represent the views or opinions of any other person or entity.


