 In my last article, I mentioned the importance of dividends in consideration of the Equity Risk Premium. Following from that, it is possible to calculate an implied Equity Risk Premium (ERP) by looking at dividends. Dimson et al (2002) and Damodaran (2011) both made contributions to this method but first it is important to understand the role that dividends play in calculating historical and present ERP. Dimson et al (2002 p.149) stated that “Over a single year, equities are so volatile that most of an investor’s performance is attributable to share price appreciation or depreciation.” To quantify this, in an earlier article we looked at the difference between investing £1 in equities and £1 in Gilts. From 1976 to 2012, £1 in equities would have grown to £12.18 and the £1 invested in Gilts would have become £4.92 (total returns). Dimson et al (2002 p.151) adds that the “longer the investment horizon, the more important is the dividend income.” They add that looking at total returns is of fundamental importance to calculating the ERP as indexes (p.151) “that record only capital appreciation cannot be used to make comparisons over time since the level of dividend yield fluctuates over the years.”
Figure 1 below illustrates the importance of dividends, and precisely dividend reinvestment, to the index:
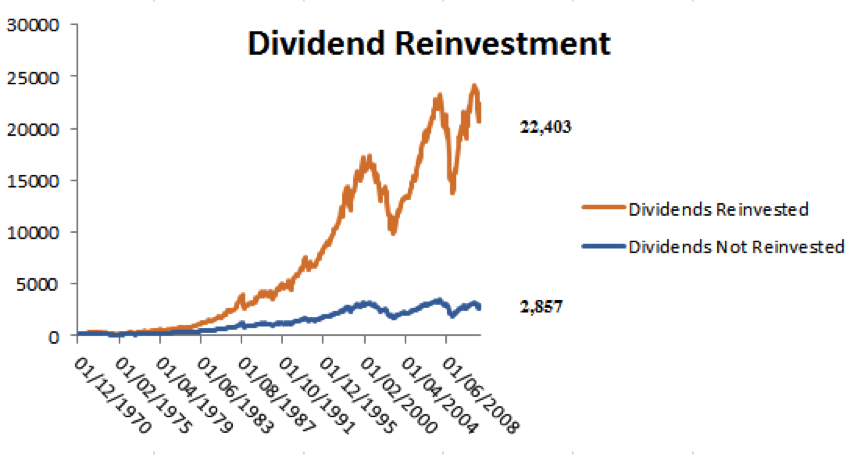
Figure 1: FT All Share: Dividend Reinvestment
The figure above makes it evident that if the Equity Risk Premium is calculated against an index which does not account for dividend reinvestment, the ERP will be considerably lower than all previous estimates. From the same data, we can see the difference to the ERP, on a real annual basis, reinvesting dividends always results in a higher premium. Figure 2 depicts this:
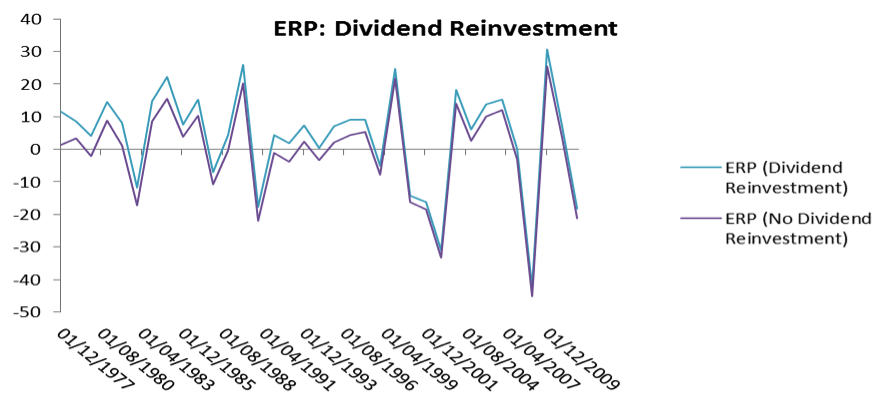
Figure 2: ERP – Reinvestment vs Taking Dividends
To put this in to context for an investor, Figure 3 clearly shows the difference dividend reinvestment makes to an initial £100 investment. This is over a 32 year time period and results in a delta of £800
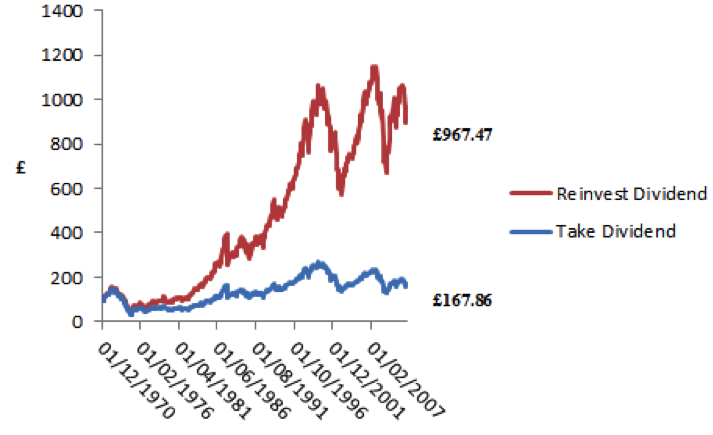 Figure 3: £100 Investment
Damodaran (2011) explained that current equity prices and expected cash flows should enable us to calculate the Equity Risk Premium. In the first instance we may consider the following example. We can use the Gordon Growth Model, as discussed earlier in this paper. As a reminder, the formula is:
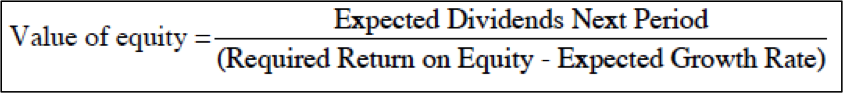
Figure 4: Solving for r (Source: Damodaran 2011 p.57)
We know three of the components of this formula:
- On the 30th of April 2012, the FTSE All Share stood at 2,984.67. This corresponds to the value of equity.
- On the same date the dividend yield was 3.45%. Given that we do not have an analyst consensus on a different figure, and for the purposes of this example, we will use this as the expected dividend next period.
- Since 1970, the average growth rate has been 4.1955% (this is an assumption as recent performance would suggest a lower growth rate). This provides the expected growth rate.
This allows us to solve for the required return:
2,984.67 = (0.0345*2,984.67)/(r – 0.041955)
r = (102.9711 + 125.2218)/2,984.67
r = 7.6454%
As we will see, this would result in an Equity Risk Premium of less than 3%. Earlier in this paper we proposed a wide range for the risk-free rate, 0.19% for one month gilts to 26.22% for Gilts over 15 years. Determining the risk premium depends upon the risk free rate chosen, and, in this instance, the expected return would also be reduced if we used a lower growth rate than 4.1955%. It is interesting to note that the expected growth rate in this example is close to the return on a basket of Gilts up to 5 years. This can let us assume, as Damodaran (2011 p.57) pointed out, that the growth rate equates to the risk-free rate, “if we accept the stable growth dividend discount model as the base model for valuing equities”. In his paper, he suggested that this would be a long-term risk free rate; with our data I suggest that it is medium term. Using the return on Gilts up to 5 years (4.7%), in this example we would have an ERP of (7.6454 – 4.7) 2.9454%
Damodaran (2011) goes on to point out that the dividends yield may be used as a measure of the Equity Risk Premium, an assertion also made by Rozeff (1984) and Fama and French (1988). He reaches this conclusion in the following manner, following on from our equation in Figure 4:
Dividends / Value of Equity = Required Return on Equity – Expected Growth
Dividend Yield = Required Return on Equity – Risk free rate
Thus the Dividend Yield = ERP
This is supported by Ilmanen (2011 p.104) who summarises: “The required return on equities……….can be viewed as the riskless long-term Treasury yield, Y, (medium term Gilts in our case) and the required equity-over-bond risk premium, the ERP.” Damodaran, however, points out though that this model will not work in the event of:
- Companies holding back cash, which is they do not pay out all they can in dividends. This has been witnessed recently with an increased number of share buy-backs and in principle this results in higher capital appreciation.
- With this model there is always an issue with extraordinary growth rates in the early years.
Our estimations of the Equity Risk Premium vary depending upon the risk free asset chosen and from our earlier articles, looking at the annualised ERP over thirty-six years the premium was 3.47%. It is perhaps slightly coincidental that the dividend yield on our selected date for the above calculations was 3.45%, as the date ranges do not coincide completely, but this example gives some confidence to using the dividend yield as a measure for the ERP, especially as it is consistent with our previous findings (3.4722% for the FTSE All Share, 1977 to 2012, as mentioned).
Damodaran (2011) also proposes another method by which to calculate the prospective ERP. This is done by looking at an index, considering the future growth and discounting back to the index level you started with. This is best illustrated by an example. Damodaran (2011) started his exercise with data from 2008; I propose to do the same as that will allow us to include the financial crisis.
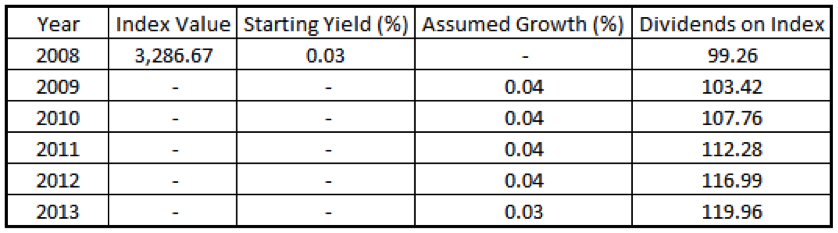
Figure 5: Estimated Dividends on the FTSE All Share Index – December 31st 2007
This table is made up as follows:
- Starting Yield is the yield on 31st December 2007
- Assumed growth is the average yield since 1970 on the index
- For 2013, I have used the annualised return on Gilts (5 to 15 years) to calculate the terminal value.
As Damodaran (2011 p60) points out, if “we assume that these are reasonable estimates of the expected dividends and that the index is correctly priced, the value can be written as follows:”
3,286.67 = 99.26 + 103.42 + 107.76 + 112.28 + 116.99 + 119.96
(1+r) (1+r)2 (1+r)3 (1+r)4 (1+r)5 (r-0.02533)(1+r)5
The last term calculates the terminal value, based on the risk-free rate discounted back to 2008. Unfortunately it is a process of trial and error to calculate r. When the equation is solved, we arrive at 5.74%. If we then subtract the risk free rate that we have used, (the return on Gilts of 5 to 15 Years) 2.53%, we have a prospective Equity Risk Premium of 3.21%. As we pointed out above, this may underestimate the premium as there has been a practice of share buy-backs since the global financial crisis. Re-evaluating the risk premium each year would also entail renewing estimates of the risk-free rate, the level of the index and Damodaran (2011) also factored in share buybacks. To do this, he used the dividend yield and added the buybacks, therefore using a higher cash flow figure than using dividends yield alone, but more realistic. From his calculations, Damodaran (2011 p.64) concluded that; inter alia, the “implied equity premium has generally been lower than the historical risk premium for the US equity market”. This holds true for the UK market as well, as our calculations come in lower than the historical assumption of worldwide 6% risk premium. Using this method, we have a slightly higher ERP valuation than calculated earlier using the Gordon Growth Model (2.9454%). These prospective estimates tie in with Gregory’s (2007 p19) estimates that the “unadjusted risk premium ranges between 2% and 4.33%.” Dimson et al (2011 p14) conclude that “investors expect a long-run equity premium (relative to bills) of around 3% to 3.5% on a geometric mean basis.” Our main difference to this, based on our data, is that we have used 5 to 15 year Gilts as the benchmark risk free rate. Again, with our data set, if we used Gilts of a shorter duration, our prospective ERP would be lower as their yields are higher.
Thanks for tuning in to learn more about dividends and Equity Risk Premium. For quick reference, here is the link to the entire series on Equity Risk Premium.
References
- Damodaran, A. (2011) Equity Risk Premiums (ERP): Determinants, Estimation and Implications – The 2011 Edition Stern School of Business
- Dimson, E., Marsh, P., and Staunton, M. (2002) Triumph of the Optimists: 101 Years of Global Investment Returns Princeton University Press
- Dimson, E., Marsh, P., and Staunton, M. Equity Premia Around the World Rethinking the Equity Risk Premium (Edited by P. Brett Hammond, Jr., Martin L. Leibowitz, and Laurence B. Siegel) Research Foundation of CFA Institute (2011)
- Fama, E. F., and K. R. French. 1988. Dividend yields and expected stock returns. Journal of Financial Economics, v22 p3-25.
- Gregory, A. How Low is the UK Equity Risk Premium? XFi Centre for Finance and Investment, University of Exeter (2007)
- Ilmanen, A. Time Variation in the Equity Risk Premium Rethinking the Equity Risk Premium (Edited by P. Brett Hammond, Jr., Martin L. Leibowitz, and Laurence B. Siegel) Research Foundation of CFA Institute (2011)
- Rozeff, M. S. 1984. Dividend yields are equity risk premiums, Journal of Portfolio Management, v11 p68-75.
Twitter: @MillarAllan @seeitmarket
Any opinions expressed herein are solely those of the author and do not in any way represent the views or opinions of any other person or entity.
 Rolling Over At Key Fibonacci Level?")


