![]() US stocks rise higher; and higher still. Is it getting frothy out there yet?
US stocks rise higher; and higher still. Is it getting frothy out there yet?
The small-cap benchmark Russell 2000 index is now up +31.9% to date. That performance has unfurled in a genuinely amazing demonstration (to the point it feels like orchestration) of time and price symmetry in the rising channel depicted here:
Russell 2000 (TF, RUT, IWM) – Daily: 2013 Year-To-Date (click image to zoom)
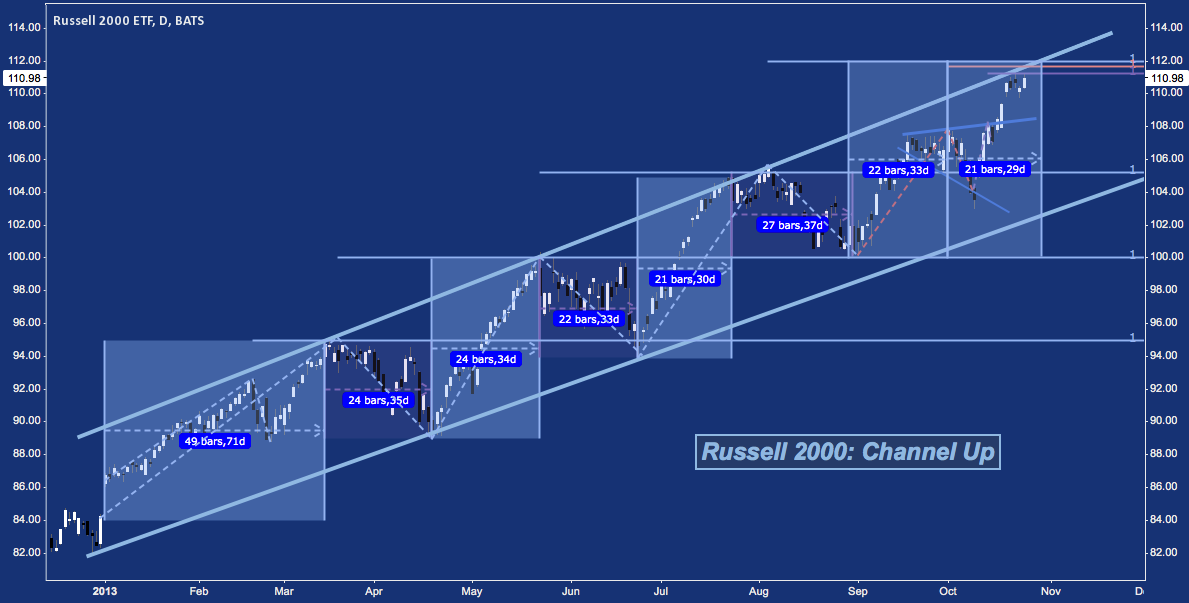
As you can see, R2k is at channel resistance once again. Previous altercations (March, May-June, July-August) with this trend line suggest a some consolidation may occur. Whether the index will break higher (the super-frothy scenario) or lower is anyone’s guess; but if the index remains as consistent as it has all year long, a decline toward 104-105 is in the cards for Q4.
Consulting the next time frame up, we discover this channel top and the fibonacci cluster resistance around 112 has significance far beyond the next month or two. The Russell 2000‘s weekly chart (on IWM here) shows there’s a dense field of resistance at this level (111-113) with cyclical implications, including a major fibonacci cluster, secondary channel resistance, and the APF median line off the 2009 bottom.
Russell 2000 (TF, RUT, IWM) – Weekly: 2009-Present (click image to zoom)
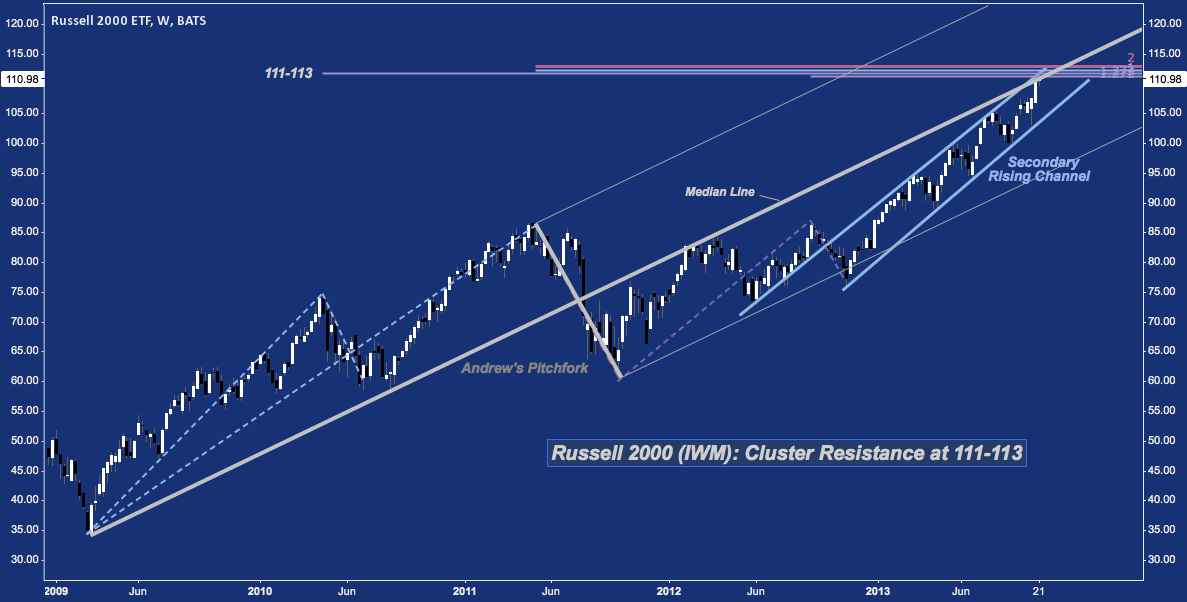
This level doesn’t appear to be “just another likely spot for a pullback”. I would argue it’s the largest technical level since Summer 2011, and probably since March 2009.
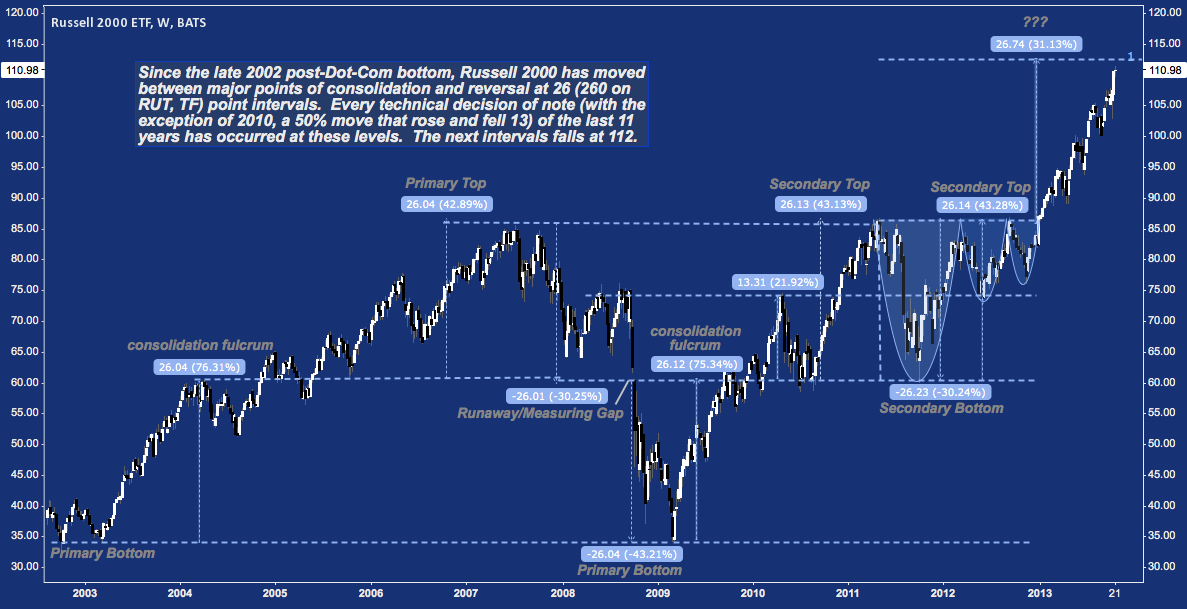
The Rule of 26 agrees. Since at least as far back as the 2002 market bottom, IWM has moved between major technical events in 26 point increments and decrements. 26 points over the 860 all time high breakout on the first day of 2013? 112.
Russell 2000 (TF, RUT, IWM) – Weekly: 2002-Present (click image to zoom)
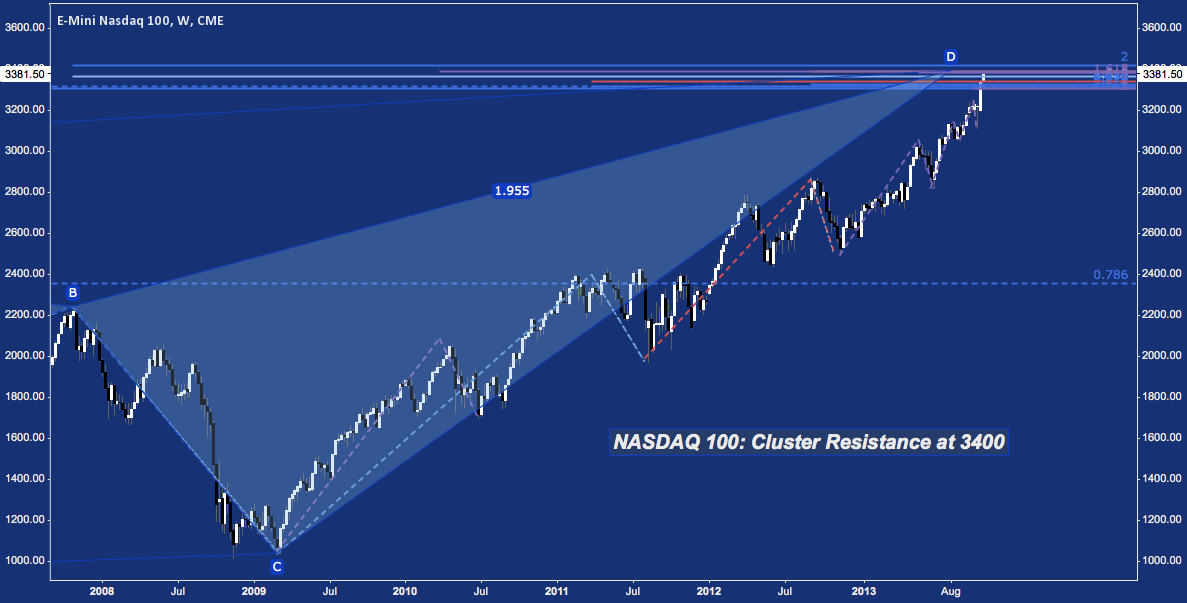
This level isn’t exclusive to the Russell. The NASDAQ 100 (futures contract NQ below) has also been on a tear this year and is up almost 230% since the 2009 low. 3400 is the level of interest here that’s comparable to IWM‘s 111-113.
NASDAQ 100 (NQ, NDX, QQQ) – Weekly: 2008-Present (click image to zoom)
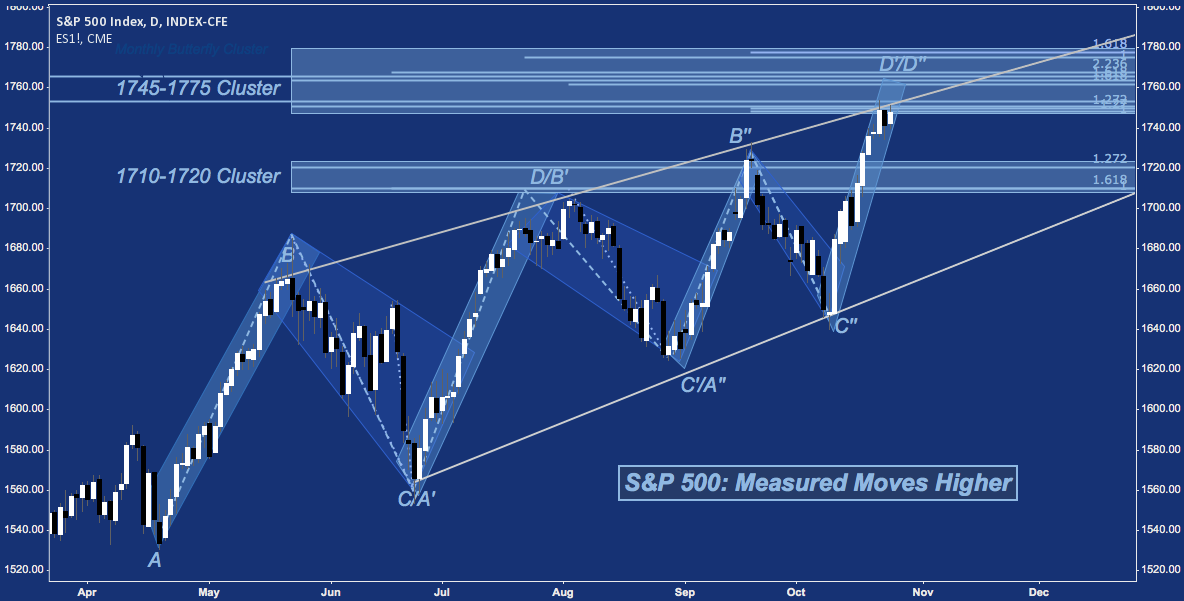
The party wouldn’t be complete with the S&P 500 (futures contract ES below). A variety of longer-term studies on the S&P are consonant with those on the Russell and NDX above, but here we’ll dial it down to specific levels. 1745-1775 in general and 1760-1765 in particular completes the index analogy.
S&P 500 (ES, SPX, SPY) – Daily: April – October 2013 (click image to zoom)
Twitter: @andrewunknown and @seeitmarket
Author holds net short exposure to the Russell 2000 at the time of publication.
Any opinions expressed herein are solely those of the author, and do not in any way represent the views or opinions of any other person or entity.


")
 Ready To Break Out?")
")

