With the recent rise in stocks, the major stock market averages have begun digging their way out of the red. From the September low, the S&P 500 ($SPX) has bounced roughly 8% with another 5% to go before getting back to its prior high. While the index has made significant improvement from what many believed to have been the ‘edge of a cliff’, stocks are not quite out of the woods yet.
On August 24th, when markets were “in turmoil” and traders were beginning to pull their hair out from stress, I wrote this post: That Was Unlikely The Market Top & Where I See Things Going From Here. In summary, I laid out my thinking that I expected the market to whipsaw for a bit before potentially testing the low and bouncing higher. It seems that’s the scenario we’ve seen play out thus far. However, we can’t ignore the warnings that preceded the decline and the possible impact they can still can have on financial markets (and stock market).
So with all that, I thought it’s time to share a few charts of the broader stock market and explain my view on equities based on where we are and the environment we are in. From a seasonal standpoint, we are exiting the historically bearish six month portion of the year, giving stocks a bit of a tailwind. That said, the major stock market indices are also approaching critical levels of potential resistance. Can seasonality give enough of a boost to push stocks past resistance and back to new highs?
Below is a monthly chart of the S&P 500 along with two important Moving Averages and a momentum indicator (dating back to 2005). Looking at the far right portion, we can see that in August the S&P 500 broke through the 20-month and 10-month Moving Averages after a small divergence appeared in the Relative Strength Index (RSI) indicator. I show the 10- and 20-month MA’s because they have acted as support during the up trend and are commonly referenced when traders define a trend, either up or down.
In 2007, the monthly RSI went from over 70 to having price break through these two Moving Averages. Price then bounced back up and tested what had been support. Support that had been provided by these Moving Averages had then become resistance and the RSI failed to get back above 50 as the stock market continued into a bear market.
Looking at present day, we saw the Relative Strength Index bounce on its mid-point, a bullish sign that momentum may still be in a bullish range. Price has been able to re-take the 20-month Moving Average but still remains slightly below the 10-month. I’ll be watching to see if stocks (i.e. S&P 500) can close back above these two important levels.
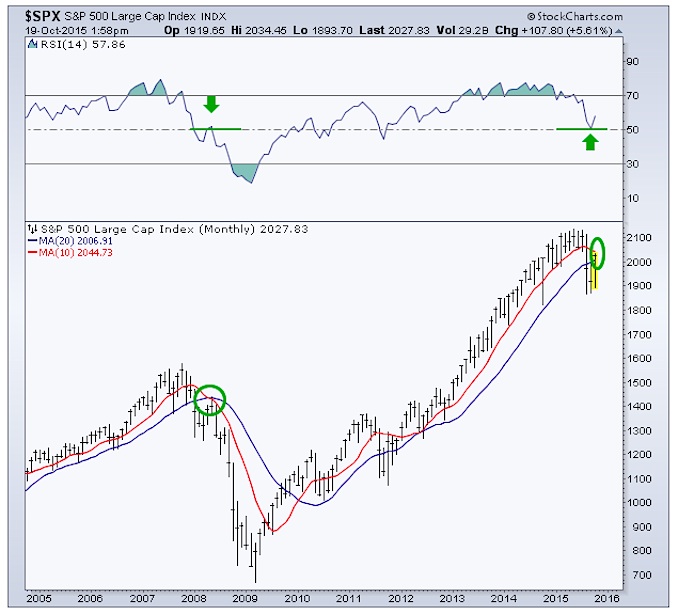
Another example of this price action occurred at the 2000 top… Price broke below these two Moving Averages in late 2000 while the Relative Strength Index dropped under 50. An attempt to regain the 20- and 10-month MAs was made but failed and momentum was unable to get back above its mid-point. A bear market for stocks then followed as the 10-month Moving Average that had been support during the up trend switched to act as resistance during the multi-year down trend.

Zooming in a bit, below is a weekly chart of the S&P 500 since late 2012. We can see a similar setup with the 50-week and 20-week Moving Average. Where they had once been support but are now is being tested as possible resistance. These shifts in being support and becoming resistance help show a change in psychology and market sentiment. It doesn’t require an understanding of what’s going on in China, Washington DC, or individual corporate board rooms – just price.
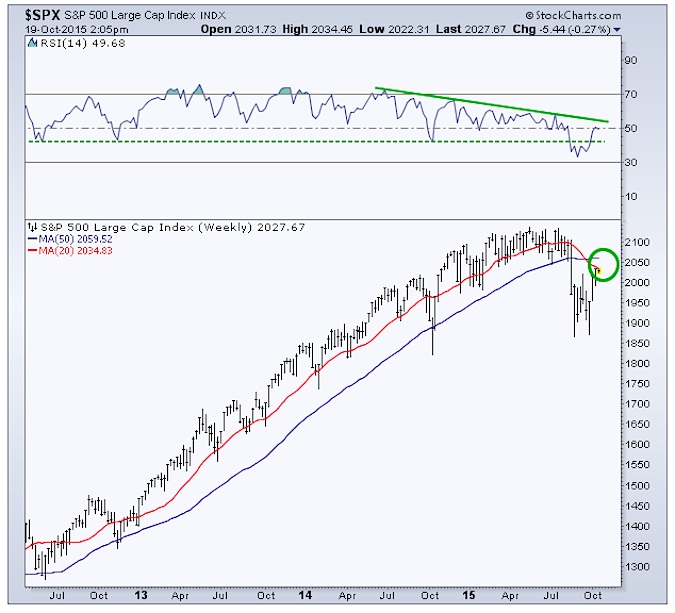
I call these next few weeks ‘the make or break’ moments for stocks because how they act around these moving averages, in my opinion, will help give traders a better idea about if the market is in the process of shifting from a bull to a bear market. I don’t believe that decision has been made, not when we are this close to a prior high, at this very moment. A fail at these levels of potential resistance, following declines in breadth and momentum, would check quite a few boxes that have led to prior bear markets – while they aren’t requirements they do act as a fairly consistent road map for the stock market. If price can move above these levels then it’s likely we see the prior high tested and taken out as the bulls remain in control. Price is what matters so that’s what I focus on.
Thanks for reading.
The information contained in this article should not be construed as investment advice, research, or an offer to buy or sell securities. Everything written here is meant for educational and entertainment purposes only. I or my affiliates may hold positions in securities mentioned.
Twitter: @AndrewThrasher
Read more from Andrew on his Blog.
Any opinions expressed herein are solely those of the author, and do not in any way represent the views or opinions of any other person or entity.


")


