January soybean futures ended the week lower, closing down 7 ¾-cents per bushel on Friday afternoon finishing at $8.55 ¼. That close was within 5 ¼-cents of the current contract low in SF6 of $8.50, which was established on 11/10.
The soybean market turned aggressively lower on Tuesday following the release of the USDA’s November 2015 WASDE report. In that report the USDA increased the 2015/16 US soybean yield to a record 48.3 bushels per acre, which was 0.8 bpa higher than both the average trade guess, as well as, last year’s final yield of 47.5 bpa.
Total US soybean production increased 93 million bushels versus the October estimate; improving to a new record high of 3,981 million bushels.
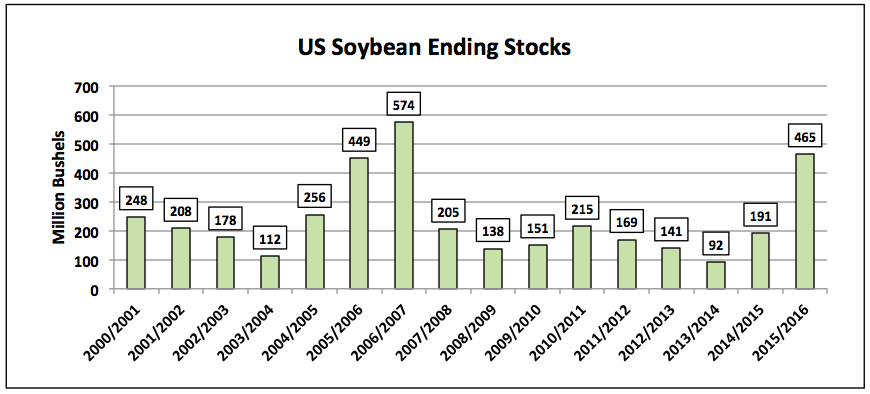
On the demand side of the equation the USDA did increase both the soybean crush and exports by a combined 50 million bushels; however that was not enough to prevent an increase to ending stocks. The 2015/16 US soybean carryout was raised to 465 million bushels versus 425 million in October and just 191 million in 2014/15. This represents the largest US soybean carryout since 2006/07 (574 million bushels).
US Soybean Ending Stocks – 2000-2015
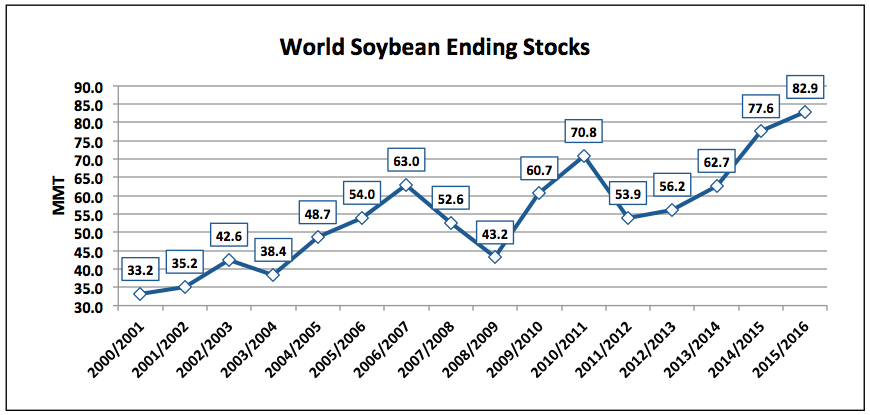
The latest supply and demand numbers out of the world soybean market were not bearish; however they certainly weren’t supportive either. 2015/16 World soybean ending stocks fell slightly to 82.9 MMT; however that still represented a record high, exceeding the previous mark by 5.3 MMT. Brazil’s 2015/16 soybean production forecast was left unchanged at 100 MMT (also a record) with Argentine production estimated at 57 MMT, down 3.8 MMT from a year ago.
Collectively, the 3 largest soybean producers in the world (United States, Brazil, and Argentina) are expected to produce 265.4 MMT in 2015/16 versus 263.9 MMT last year and 231.6 MMT in 2013/14. Global soybean supplies continue to grow exponentially while demand gains have been much more measured. China, the world’s largest soybean importer representing approximately 64% of total world soybean imports, is projected to import 80.5 MMT of soybeans in 2015/16, up just 2.7% from the previous marketing year.
World Soybean Ending Stocks 2000-2015
Further reading from Marcus: US Corn Futures Test Lows On USDA November WASDE Report
PRICE FORECAST:
The only technical price support I can find for soybean futures at the moment is the actual price. Soybean futures continue to trade at their lowest level since 2009 (day low in 2009 was $8.43 ¼ on March 2nd). The average front month soybean futures price from 2011 through 2014 was $13.58 per bushel. Compare that to the current futures average of $8.83 per bushel from September 1st through November 13th, 2015. Therefore from purely a historical price comparison perspective soybean futures “feel” undervalued or even possibly oversold.
The reality is however, from a fundamental point of view, soybean futures have a host of significant S&D barriers to overcome before traders even entertain transitioning to a more supportive forward view. The most notable bearish price influences include:
- The aforementioned record World soybean stocks estimate for 2015/16 and the highest US soybean ending stocks forecast since 2006/07
- Year-to-date US soybean export sales of 1,070.7 million bushels as of the week ending November 5th, which is down 275.5 million bushels versus a year ago or approximately 20%
continue reading on the next page…


