 From the moment US Dollar Index Futures (DX) opened this week’s trade on Sunday evening, the Greenback has been under pressure. Coming on the heels of a historic streak of 12 consecutive weeks higher and a nominal advance of +8.25%, the last 80 hours of trade have seen USD shed -2%, returning the trade-weighted benchmark measure to the site of last week’s historic symmetrical triangle breakout near 85. Is the US Dollar taking a well-deserved breather, merely pulling back to a logical point of support before pivoting higher still? Or is the USD on the brink of a major breakout failure that will see it give back much of the ground it has gained since this latest bout of monstrous strength began in early July?
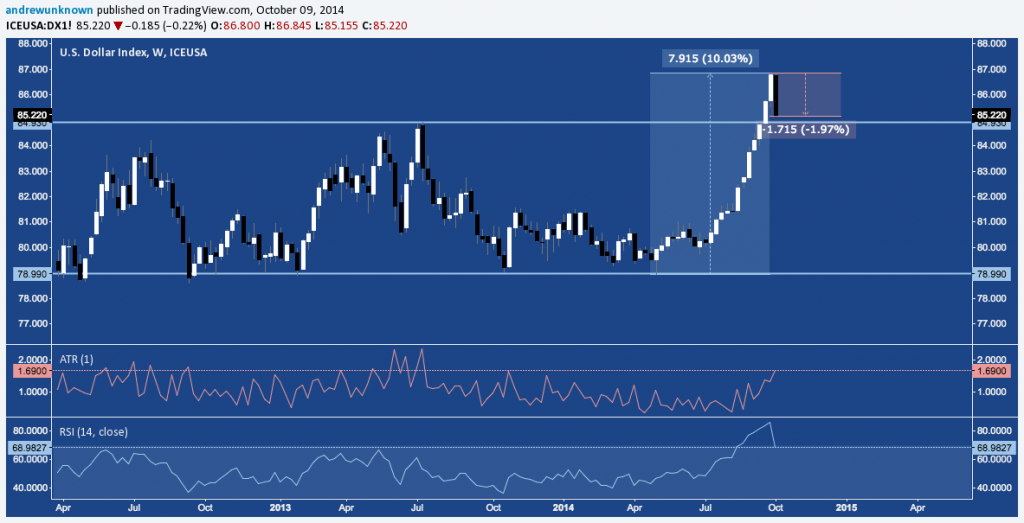
US Dollar Index (DX) – Weekly: Back to The Horizontal Breakout Above 85
DX has retraced all of last week’s gains and much of the prior week, installing it’s largest weekly range (see ATR at bottom) since July 2013. At last week’s peak, the index had advanced over 10% off low marked by the ECB’s May 8th policy meeting.
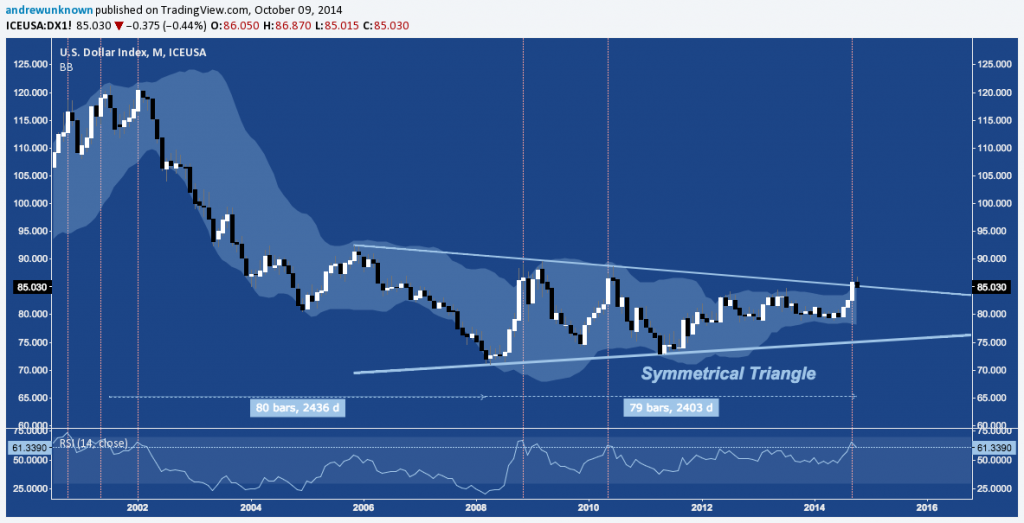
US Dollar Index (DX) – Monthly: Symmetrical Triangle Breakout. Pullback or Failure?
The USD has spent over 6.5 years oscillating in a massive Symmetrical Triangle, consolidating a decline of equal length that begin with July 2001’s multi-decade high at 121.29. Last week the index broke above this pattern’s upper trend line near 85 but is finding horizontal resistance at closing levels seen in 2009 and 2010 at 86.60-86.70, capping out last Friday at 86.87 before turning lower. Highly overbought in consistency with these peaks, the pullbacks that typically result cast doubt on whether this breakout can avoid regression back into the triangle’s range.
As with any index, to better understand it’s developments we can look at it’s constituent parts. For DX this primarily means evaluating the Euro (EUR, 57.6%), Japanese Yen (JPY, 13.6%) and British Pound (GBP, 11.9%), together comprising nearly 85% of the index.
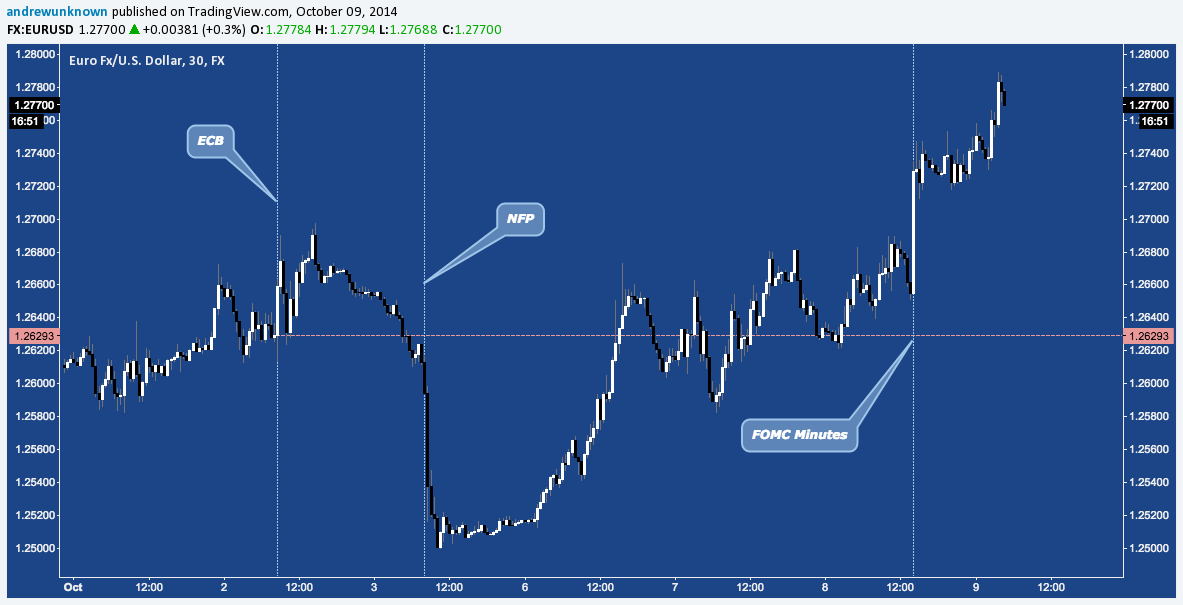
Last week’s technical overview of the EUR/USD approached this question from the Euro’s point-of-view, considering three potential outcomes for the pair in the wake of last Thursday’s ECB policy decision, including a Dead Cat Bounce which is now underway. The ECB and then Friday’s NFP effectively whipsawed EUR/USD to 1.27 and then almost as low as 1.25; but since Sunday’s open the pair has added nearly 250 pips and is now +1% above where ECB President Mario Draghi’s press conference began:
EUR/USD – 30-Minute: ECB, NFP, FOMC Minutes
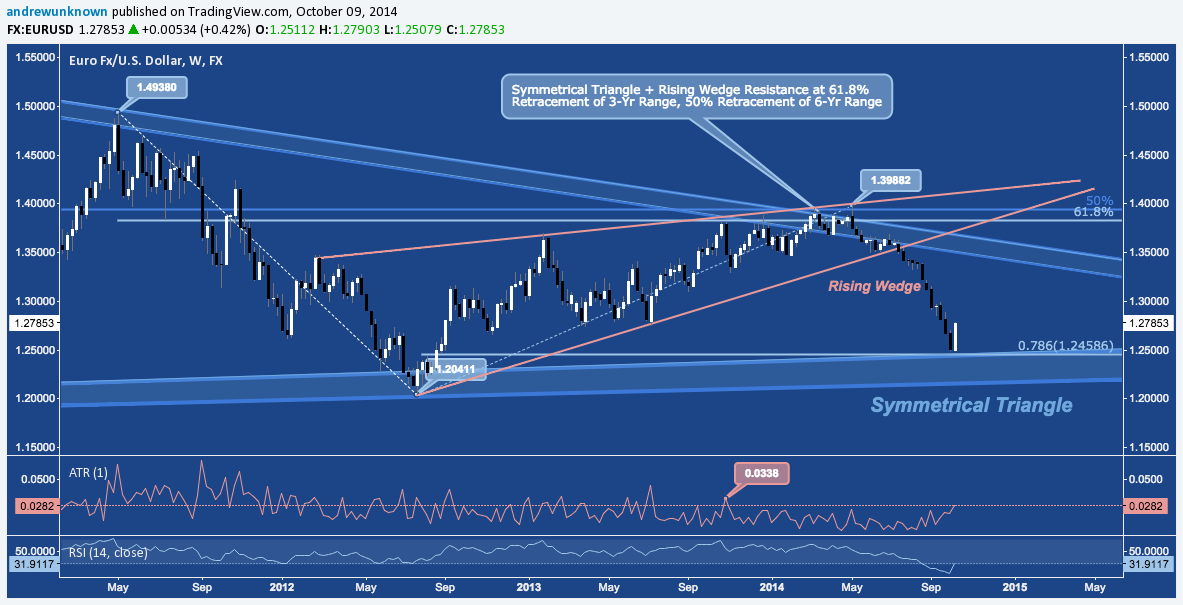
EURUSD’s volte-face occurs just above the 78.6% fibonacci retracement of the July 2012-May 2014 range and major Symmetrical Triangle trend line support near 1.25, creating the largest weekly range since October 2013 and largest up-candle since July 2013.
EUR/USD – Weekly: Best Week in 50 As Pair Rallies Above Key Support
Whether EUR/USD’s Dead Cat Bounce will build into a durable bottom remains to be seen. Major technical support and CoT positioning (also discussed in last week’s post) suggests the capacity for a larger short-covering rally is there, even if the pair does turn over in the medium-term, buoying the US Dollar as a result.
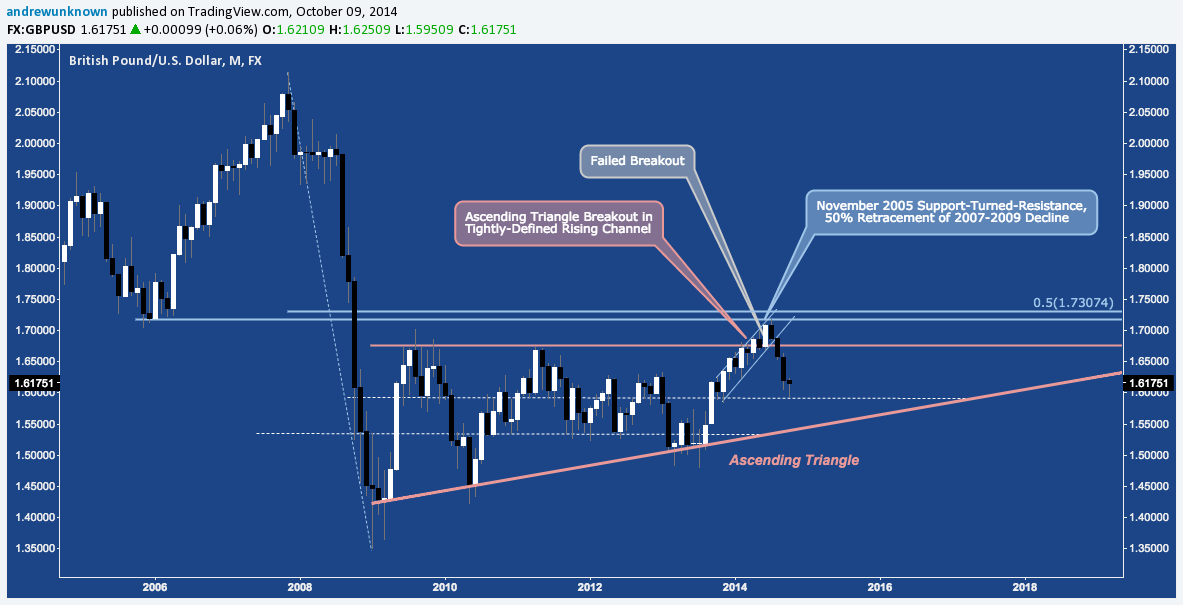
The Pound Sterling has not rallied as aggressively as the Euro this week, but it has nearly retraced late last week’s losses against the US Dollar, bouncing off of horizontal support near 1.60 to produce the hammer candlestick on GBP/USD‘s monthly chart, below. Like EURUSD, Cable has been sold off steeply since July; and while this week’s rally does nothing to change it’s longer-term picture, it does contribute to the collective pressure DX constituents are putting on the Greenback:
GBP/USD – Monthly: Cable Bounces Into Hammer At Key Support Near 1.60
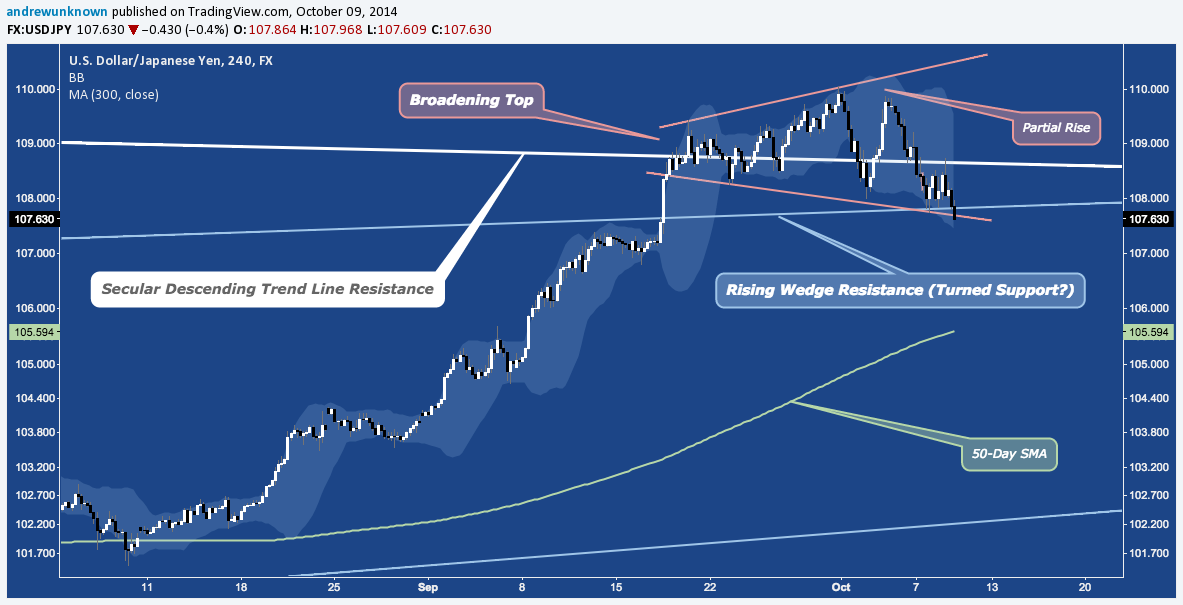
Like the Euro, the Japanese Yen is seeing a tentative bid against the US Dollar at a critical support level. USD/JPY has been consolidating August-September’s 800-pip run higher off 102 with a 3 week Broadening Top pattern. The pair is now testing a confluence of supporting trend lines as broad-based USD selling continues post-FOMC Minutes.
USD/JPY – 4-Hour: At Broadening Top Support
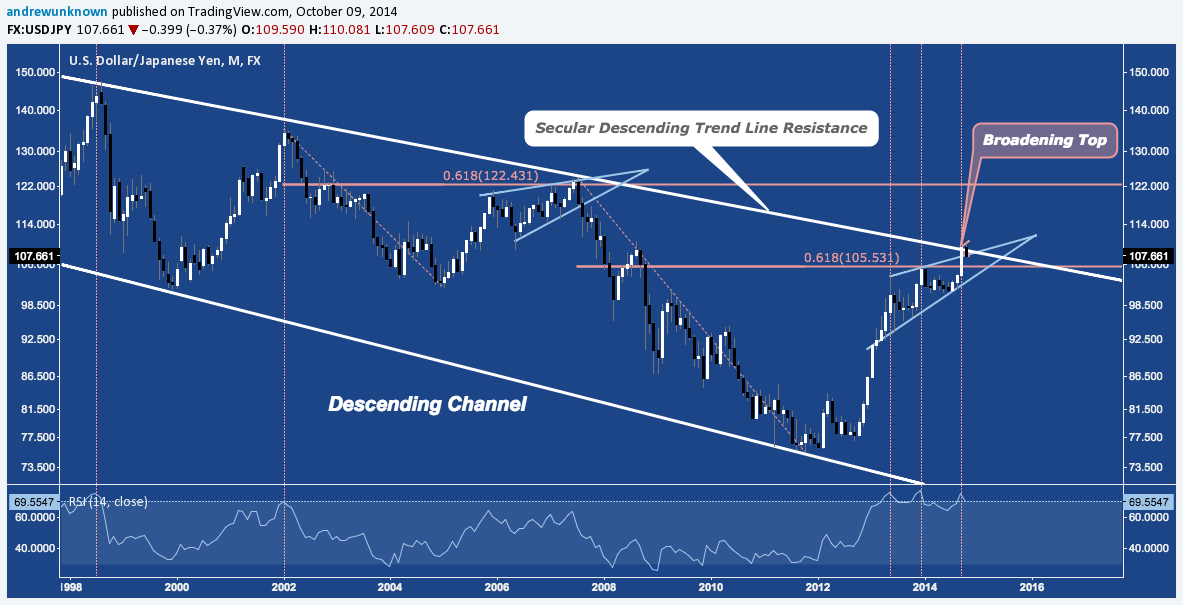
A resolution lower from this Broadening Top constitutes a breakout failure above secular descending trend line/channel resistance. Like DX, USD/JPY is historically overbought, loudly begging the question of whether a breakout now is viable – especially given the subsequent performances after the peaks in May 2013 and January 2014 (-9.6% and -4.2%, respectively).
USD/JPY – Monthly: Testing Secular Resistance
After DX’s record-setting streak higher and with so little speculative short positioning, the long side of the boat has gotten incredibly full. Is it enough to capsize the US Dollar? Major support levels on EUR/USD and USD/JPY – 70% of the index, by weight – suggest any material upside to and through last week’s high at 86.87 will be hard-fought. Whether and how the index holds or folds at 85 will determine if USD remains on the offensive or switches into a deeper retracement of the ground is covered since mid-Summer.
For further reading, check out these posts here on See It Market from the last two weeks:
- Why Thursday’s ECB May Spark a Major Euro Rally by Andrew Kassen
- Why The US Dollar Rally May Stall Out In October by Andy Nyquist
- US Dollar Strength Continues: Weekly Close Important by David Busick
Twitter: @andrewunknown
Author holds no exposure to asset classes mentioned at the time of publication. Commentary provided is for educational purposes only and in no way constitutes trading or investment advice
 Rolling Over At Key Fibonacci Level?")


