 The US Dollar has been on a tear lately. It’s set to close higher for the third month in a row. And not just marginally higher: the past three months have seen the US Dollar Index surge from sub-80 to nearly 86. No doubt this is strong action, and may very well be the beginnings of a longer-term trend change. But October has been a tough month for the Dollar and both seasonal and technical analysis indicate that the Dollar may be set for a breather.
Over the past 20 years the US Dollar has seen A LOT of fluctuation but remarkably very little change. On October 31, 1994 the US Dollar Index closed at 85.78. Yep, that’s only 0.04 off of the most recent closing of 85.74.
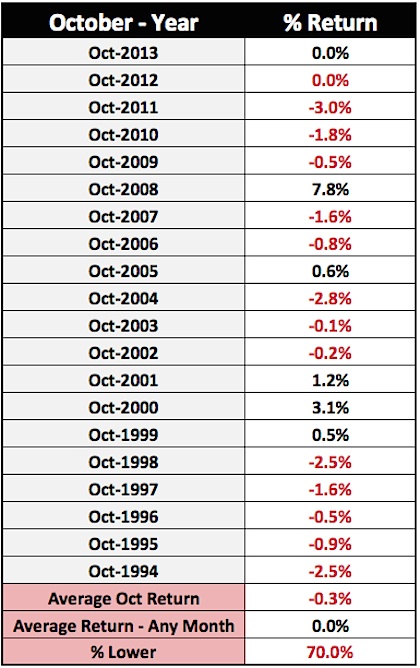
A closer look at the past 20 years of data also highlights why October may be the month to slow the US Dollar rally. In total, the Dollar has been down 14 of the past 20 Octobers, for an average loss of 0.3%. See stats below.
US Dollar Index – October Returns Over Past 20 Years
Next, let’s turn to the best indicator of all. Price. And although the action has been decidedly bullish, there are several reasons to expect a slowdown in October. Let’s start with the daily chart and work out to the weekly and monthly.
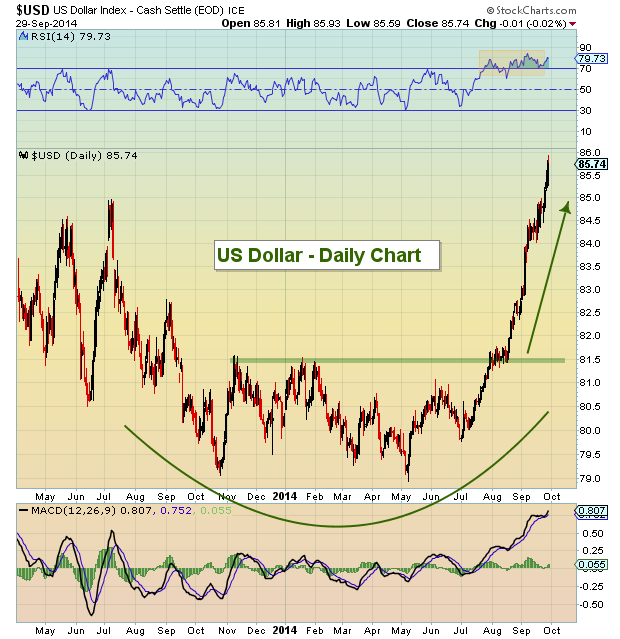
On the daily chart, you can see the multi-week rounded bottom and subsequent breakout above 81.50. Really a thing of beauty. In fact, the current move higher has taken out the July 2013 highs. But the current rally has been overbought for more than 2 months and the Relative Strength Indicator (RSI) currently stands at 79.73. As well, this move higher has been pretty much straight up without a breather.
US Dollar Index Daily Chart
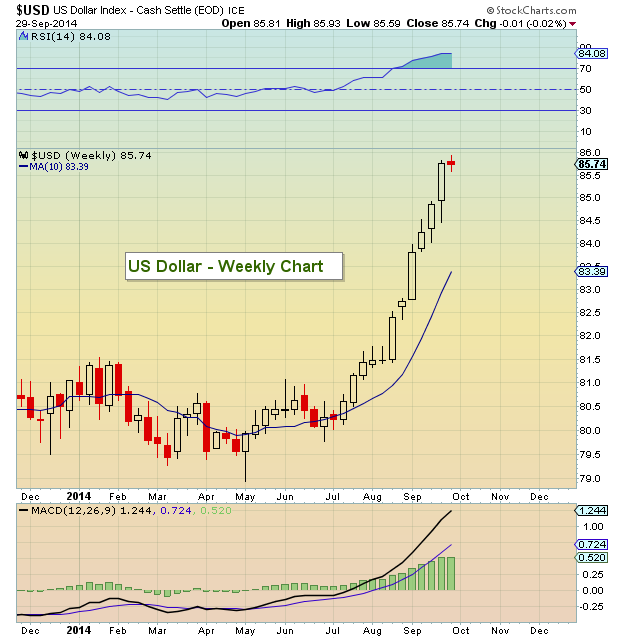
The weekly chart looks a lot like the daily. The move higher out of the base is very bullish, but the RSI is at 84.08. That is the most overbought reading since early 1997. And in that instance, the US Dollar saw a brief 3 to 4 week pullback before heading higher again. Could something like that play out in October? Seems plausible.
US Dollar Index Weekly Chart
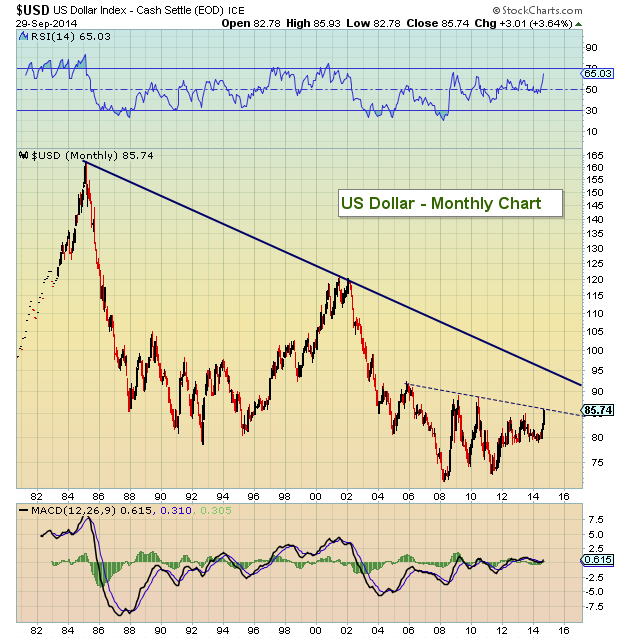
Now let’s take a look at monthly chart. The Dollar is pushing up near strong resistance around 86.00. I would expect this to stall the rally, if only momentarily. Again, the multi-year basing is bullish (and The RSI is a manageable 65.03), but this resistance could slow the US Dollar into October.
US Dollar Index Monthly Chart
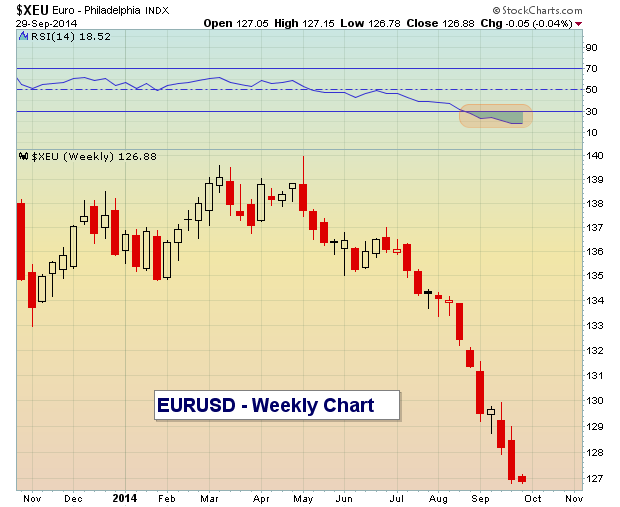
Lastly, let’s take a quick look at the EURUSD weekly chart. Not much commentary to add, the Euro zone has been very weak and the currency reflects it. But the index is oversold with an RSI reading of 18.52. Any relief rally in the Euro would likely slow the US Dollar.
EURUSD Weekly Chart
In short, the Dollar has been strong of late and may be poised for more upside. But the stats and technicals say that October could present some difficulties for the buck. Thanks for reading.
Follow Andrew on Twitter: @andrewnyquist
No position in any of the mentioned securities at the time of publication. Any opinions expressed herein are solely those of the author, and do not in any way represent the views or opinions of any other person or entity.
 Rolling Over At Key Fibonacci Level?")


 Rolling Over At Key Fibonacci Level?")

