 Today I’d like to break down some key Fibonacci levels on the US Dollar Index.
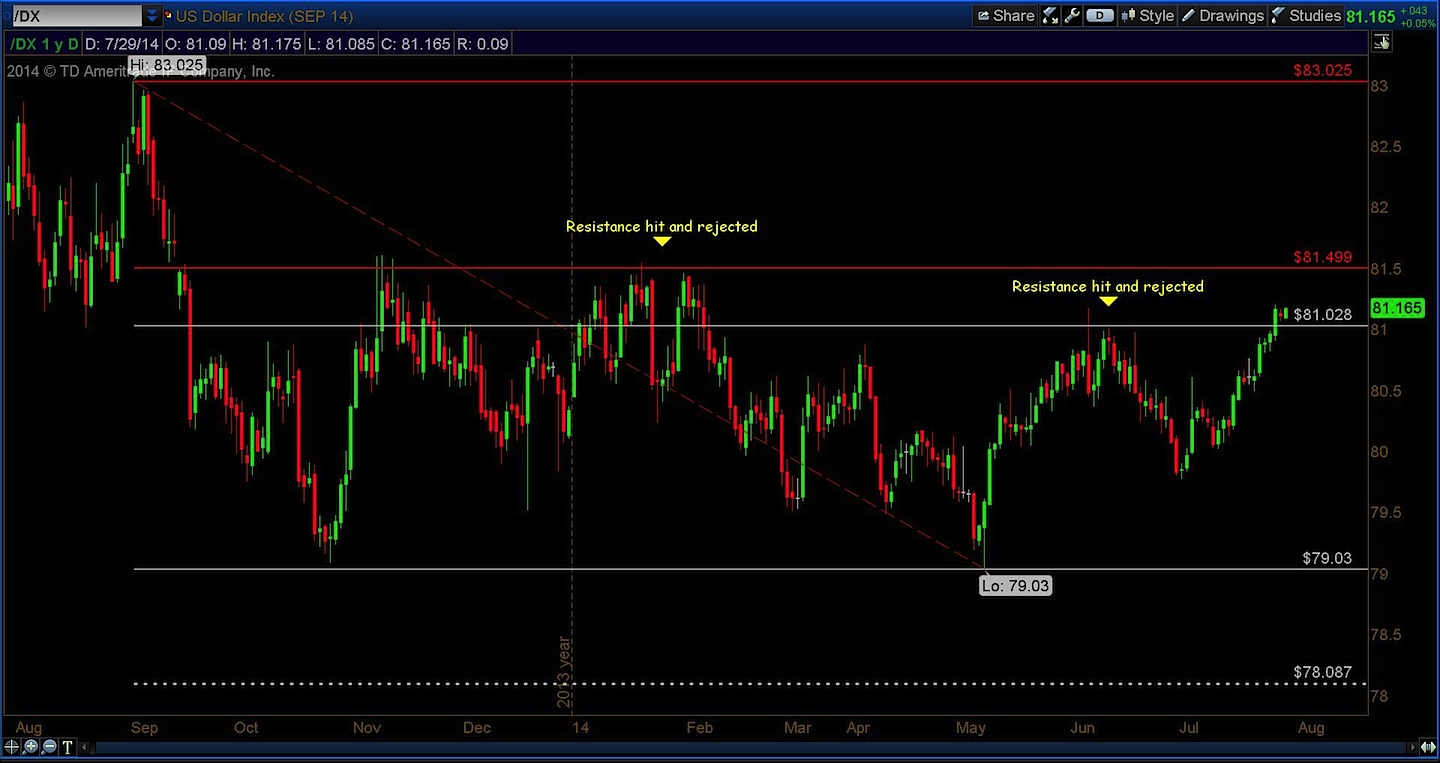
Let’s start with a longer-term view of the US Dollar. Measuring the move from the September 2013 high to the May 2014 low creates resistance levels of 81.028 and 81.499. As noted on the chart, price was rejected at these levels in January, February and June 2014.
A close on a daily candle above 81.499 would create a new, longer term upside target for the US Dollar Index.
US Dollar Index 1 Year Daily Chart
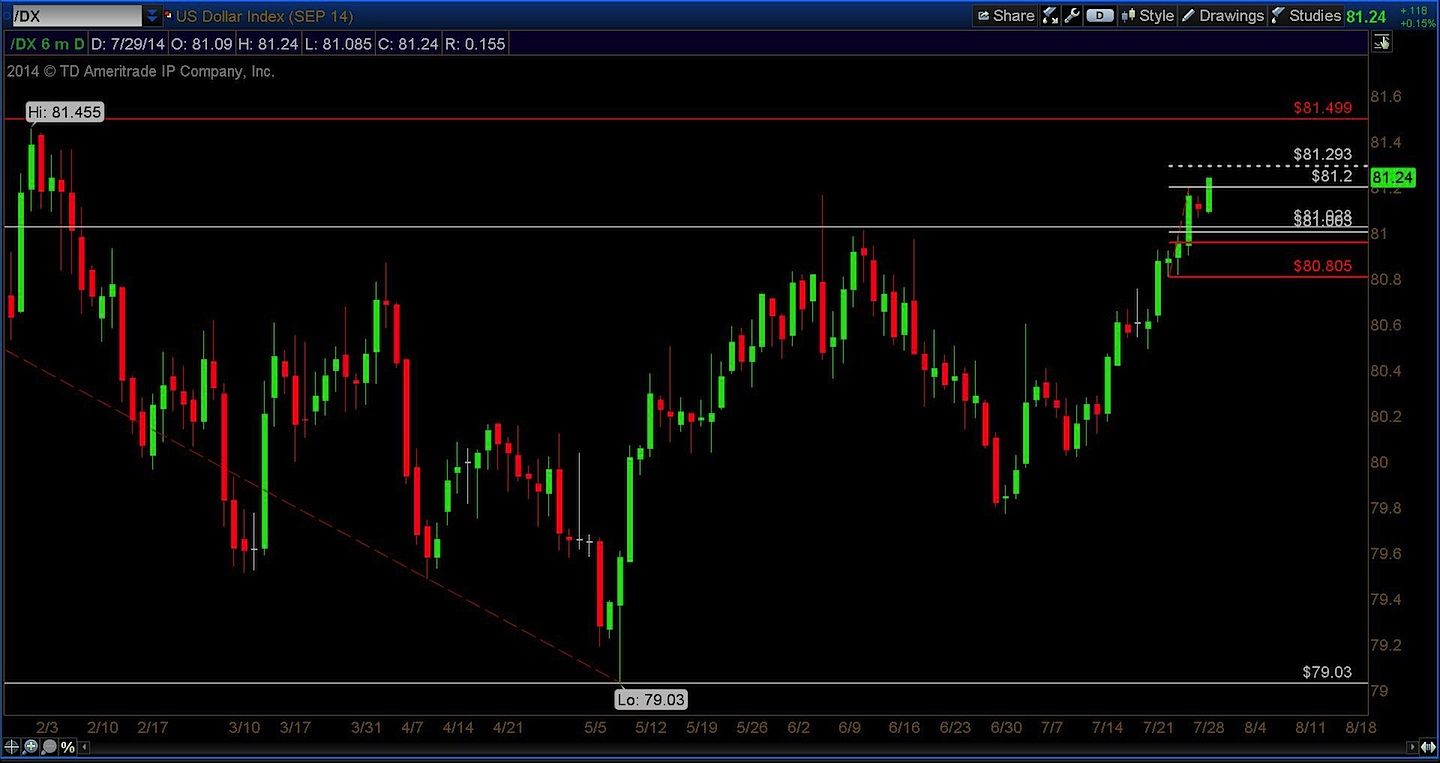
Now let’s drill down to a 6 month chart and draw a smaller fib inside the larger one. This creates a target of 81.293, which was hit as I’m typing this! The support levels are 81.003 and 80.956. That also puts the target right smack in the middle of the larger Fibonacci levels.
It’s worthy to note that price has been able to push through the June 5th, 2014 high of 81.165.
US Dollar Index 6 Month Daily Chart
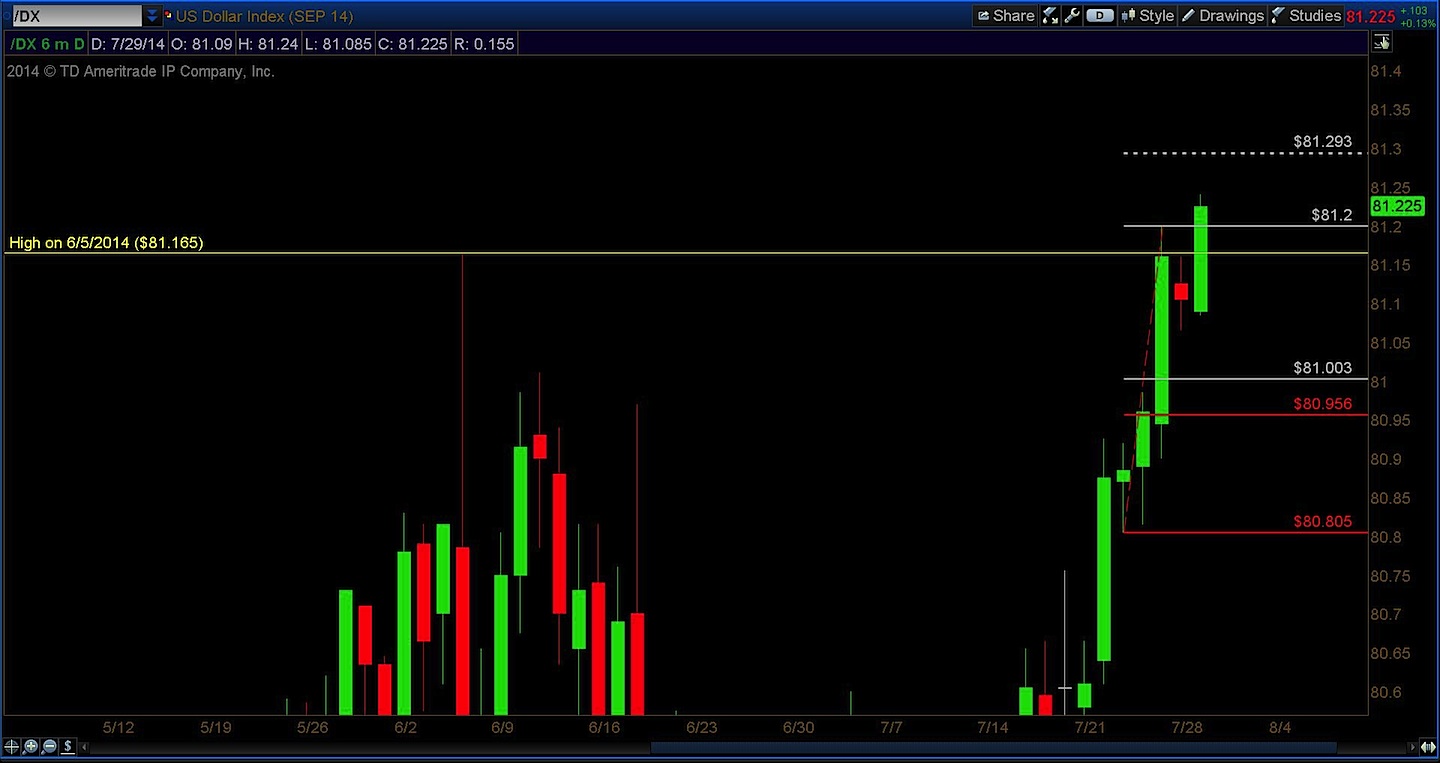
Now, let’s look at the same 6 month chart; I’ve just zoomed in on the levels to watch (see below). As I said previously, the target of 81.293 was actually hit as I was typing this post and so far is being rejected. If the daily candle can close above 81.293 that would create a new upside target.
On the support end, a close below 80.956 would create a new target to the down side.
US Dollar Index ZOOM Chart
No position in any of the mentioned securities at the time of publication. Any opinions expressed herein are solely those of the author, and do not in any way represent the views or opinions of any other person or entity.

")

")


