The US Dollar decline accelerated this morning following the release of the March Non-Farm Payrolls (NFP) report – better known as “the jobs report”. The headline number for job creation came in significantly less than consensus estimates, causing further concern over the economic plight of the U.S. economy. For more insights on the jobs report, you can read my post from earlier today.
To me, the jobs report was simply an excuse for a pull back in the Dollar. As most investors are aware, the US Dollar has been in a strong uptrend (understatement) for the past year. As you can see in the chart below, the Dollar peaked in mid-March before beginning its now 3 week old pullback. At last glance, the US Dollar decline is close to 4 percent from the recent highs.
US Dollar Index Futures – Daily Chart
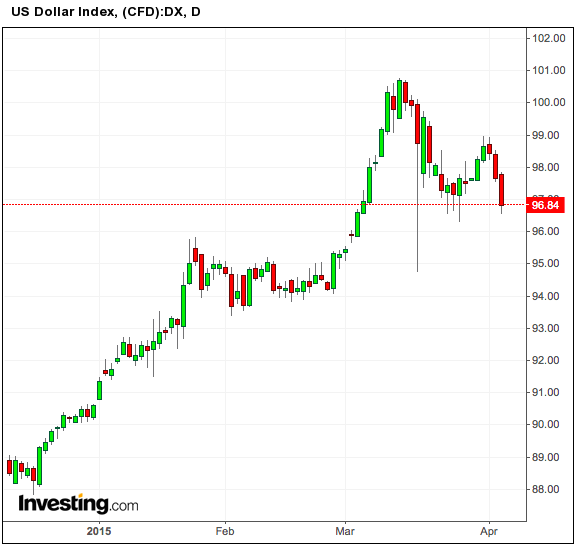
So what can we expect here?
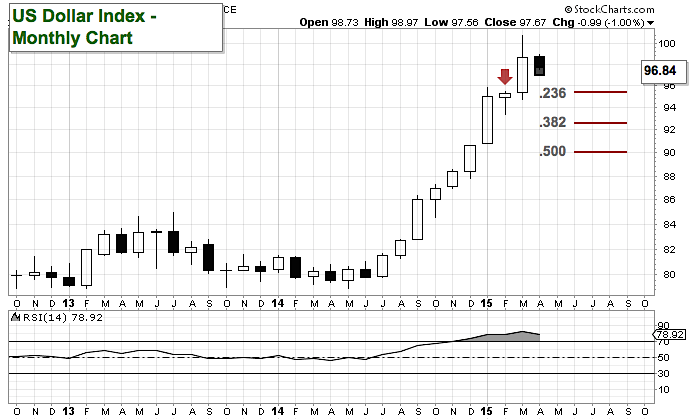
First, let’s back up a bit for some perspective – below is a monthly chart of the US Dollar. Note the vertical move higher over the past several months. This sort of powerful price action tells me that the US Dollar is in a bull market. But at the same time, it reached severely overbought levels last month, and has begun the process of working off some excess.
At 4 percent off its highs, the US Dollar likely has more downside ahead (assuming the March highs hold). Either way, further upside is likely limited until the overbought condition is worked off. In the chart below, the red arrow highlights a DeMark monthly sell setup that occurred in February. While the continuation higher into March was a sign of trend strength, we did see a reaction lower begin in March (note the upper wick). We now must wait to see if this reaction turns into a deeper pullback in April/May. The alternative would be a rangebound sideways move where the buck corrects through time as opposed to price.
It’s also worth mentioning that the Euro may need more time to work off its oversold state and this will play a role in how the Dollar proceeds.
Be sure to read fellow SIM contributor Sheldon McIntyre’s research post on the US Dollar.
Should the US Dollar decline continue, note the following Fibonacci retracement levels: 95.61 (.236 Fib), 92.45 (.382 Fib), and 89.90 (.500 Fib). Thanks for reading.
US Dollar Index Monthly Chart
Follow Andy on Twitter: @andrewnyquist
No position in mentioned securities at the time of publication. Any opinions expressed herein are solely those of the author, and do not in any way represent the views or opinions of any other person or entity.


