The US Dollar Index has been flexing its muscle since last summer and is up over 20% in less than a year. When putting the US Dollar rally into perspective, it truly has been rare and historic. Will the “historic” rise equate to a major long-term trend change higher? Perhaps.
But there is something that investors of all asset classes should be aware of regarding King Dollar right now: momentum has been slowing.
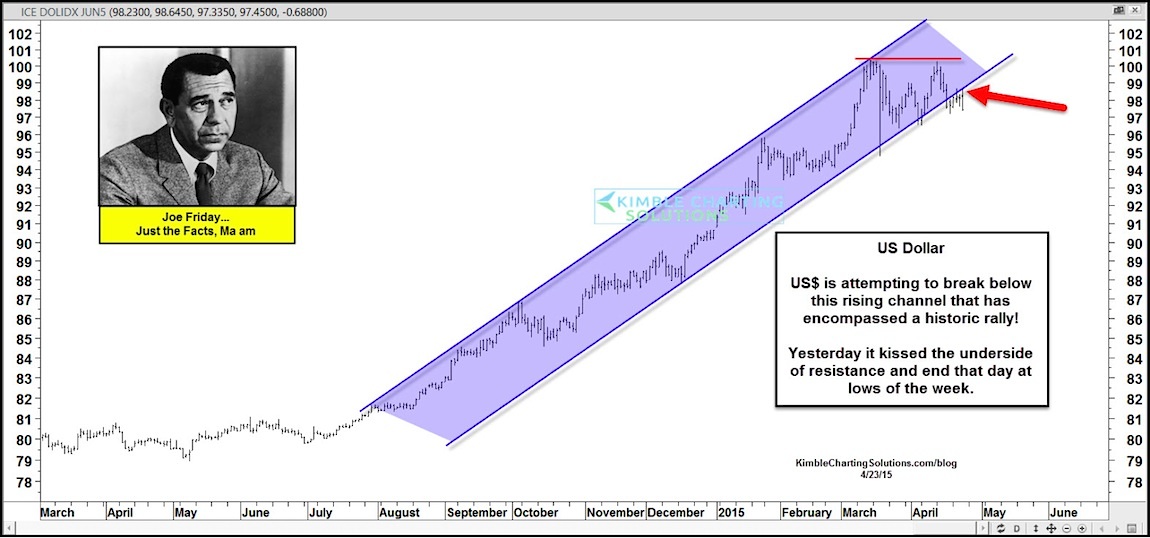
In the US Dollar chart below, you can see that a majority of the rally took place inside a steep rising channel. Over the past month the US Dollar Index may have put in a double top. And over the past few days, the US Dollar has slipped further, falling below the rising support (see red arrow).
US Dollar Chart – Watch That Channel Support!
As I showed earlier today, the US Dollar put in a reversal pattern after a big gain on its monthly chart. And when considering this with the fact that it slipped out of its rising support channel, the US Dollar is now a must watch. Should the Dollar train slow down or weaken further, the commodities sector could catch a bid and push higher.
So be sure to add the US Dollar to your watch list, especially if you are a Gold (GLD), Silver (SLV), or Crude Oil investors. Thanks for reading.
Follow Chris on Twitter: @KimbleCharting
Author does not have a position in any mentioned securities at the time of publication. Any opinions expressed herein are solely those of the author, and do not in any way represent the views or opinions of any other person or entity.

 Rolling Over At Key Fibonacci Level?")


