Monday’s Crop Progress report showed the US corn crop now 85% planted as of May 17th versus 71% last year and the 5-year average of 75%. A number of key corn producing states are nearing the finish line as far as planting is concerned. Illinois was 94% planted, Iowa 92%, and Minnesota 97%. Those three states collectively as of the March 31st Planting Intentions report were expected to plant 33.8 million corn acres in 2015, representing approximately 38% of the total US corn acreage base. At this point, I think it’s still entirely possible that all three states could add corn acres without forfeiting yield potential if producers so choose.
So what’s the market significance?
Looking specifically at Iowa and Illinois, the corn market is now forced to consider the top two corn producing states in the country possibly planting even more corn. Clearly this is posing as yet another obstacle to generating price support despite spot corn futures already trading at their lowest level since October 27th, 2014. Furthermore, last year Illinois’s final corn yield was a record 200 BPA (Bushels per Acre) with Iowa coming in at a very respectable 178 BPA versus the US national average of 171.0 BPA. Point being, historically speaking, not only do both states plant the most corn in the country; they also tend to achieve state yields ABOVE the national average. Therefore traders could be anticipating an increase to the 2015/16 US corn yield as early as the June or July Crop reports. I do think this is playing into the current sideways to lower price action in corn.
What is it going to take for a major trend change in corn? 2010 Redux?
If 2010 is any indication Corn Bulls are likely going to need a combination of events to take place over the course of the next 4 to 5 months. 2010, in my opinion, continues to serve as the closest analog comparison to 2015 in recent history. During June of 2010, December corn futures broke nearly 37-cents a bushel versus the May month-end close of $3.80 CZ through June 29th. In fact on 6/29/2010 December corn futures traded down to a day low of $3.43 ¼. What factors contributed to the accelerated sell-off during the first 29 days of June? As of May 16th, 2010, 87% of the US corn crop had already been planted. Therefore there were no significant planting delays that spring. Secondarily as of the June 2010 Crop report, US corn ending stocks were forecasted at a more than adequate 1,573 million bushels. Planted corn acreage was estimated at 88.8 million with the US corn yield projected at 163.5 BPA. Now note the similarities to this year. As of May 15th, 2015, 85% of the US corn crop has been planted. Furthermore the USDA is currently forecasting 2015/16 US corn ending stocks at a very comfortable 1,746 million bushels. Planted corn acreage is estimated at 89.2 million acres with the US corn yield projected at 166.8 BPA. Price-wise, December corn futures are currently trading just slightly under $3.80 per bushel.
That said…the HOPE for Corn Bulls is there are 30 days in the month of June. On June 30th, 2010, the day the June Acreage report was released, the USDA unexpectedly cut US planted corn acreage 926,000 acres. December corn futures responded by closing 29 ½ cents per bushel higher that afternoon and followed that up with an 11-cent higher close on July 1st. However that proved to be only the start of a rally that would continue into the first 9 days of November (CZ traded up to a day high of $6.03 ½ on 11/9/2010). The upward trend went on to be supported by additional cuts to the US corn yield, the most prominent of which occurred in October. In the October 2010 Crop report the USDA slashed the US corn yield 6.7 BPA to 155.8 BPA, which in turn lowered total US corn production 496 million bushels and resulted in US corn ending stocks falling to just 902 million bushels.
What did we learn from 2010? Rallies of substance are certainly possible even in years like 2015 during the second half of the growing season; however it’s likely going to require a supportive acreage surprise in this year’s June 30th Acreage report, as well as, future US corn yield reductions in proceeding Crop reports (weather dependent). However Corn Bulls must remember…they still have to survive the first 29 days of June before some of those potential S&D adjustments are back in play.
Corn Prices Analog Chart – 2015 vs 2010
December Corn Futures
Checking In On Ethanol
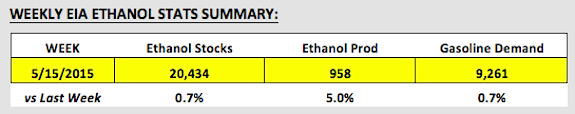
- Ethanol prices tumbled lower on Wednesday following the release of the EIA’s weekly ethanol stats. The primary culprit was a 5% week-on-week increase in ethanol production, which was reported at 958,000 bpd versus just 912,000 bpd the week prior (plants ramping back up post-spring maintenance). The production figure was fastest the industry’s run at since February 13th, 2015 (964,000 bpd). That said US ethanol inventories only moved up slightly improving to 20.434 million barrels, which represented a weekly stocks build of 135,000 barrels or 0.7%. Gasoline demand remained strong at 9.261 MMbpd versus the 4-week average of 9.042 MMbpd.
- Ethanol values in Chicago broke nearly 5-cents per gallon on Wednesday, and as of Thursday’s closes, were off approximately 12-cents per gallon versus Monday’s midpoint of $1.695 (Chicago Argo). NYH barge values were down nearly 10-cents per gallon. Over that same time period July corn futures had only declined 4 to 6-cents per bushel. Therefore the ethanol crush this week took a substantial hit, narrowing approximately 28 to 30-cents per bushel (or 9.9 to 10.6-cents per gallon based on an ethanol yield of 2.82)
Other Misc Charts on Corn, Soybeans, etc…
Thanks for reading and have a great weekend.
Data References:
- USDA United States Department of Ag
- EIA Energy Information Association
- NASS National Agricultural Statistics Service
Any opinions expressed herein are solely those of the author, and do not in any way represent the views or opinions of any other person or entity.

 Rolling Over At Key Fibonacci Level?")


