Is The Rally In Corn Futures Already Over?
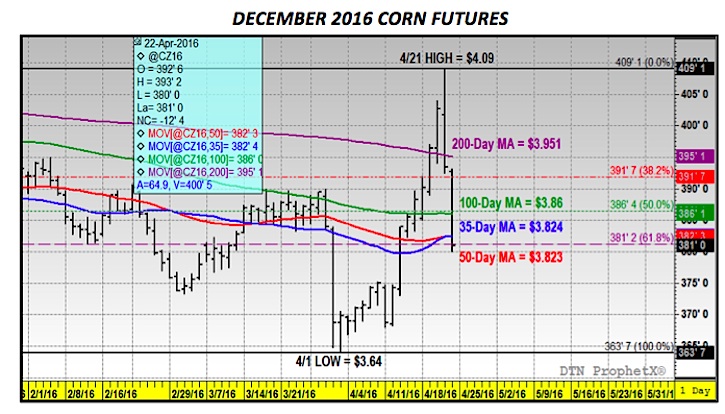
With December corn futures surging to a day high of $4.09 on Thursday morning (highest level since 11/4/2015) and November soybeans spiking to a day high of $10.23 ½ (highest level since 12/29/2014), it appeared as though all the Supply and Demand haters, who suggested this corn and soybean rally lacked any fundamental justification, would eat their words for at least another week.
And then in a period of 24 hours, it was over.
Friday afternoon, December corn futures limped to the finish line, closing at $3.81 per bushel, DOWN 12 ½-cents on the day, DOWN 7 ¼-cents for the week, and 28-cents removed from Thursday’s 5 ½-month day high. November soybean futures didn’t fare any better closing on Friday at $9.83 per bushel.
This begs the question, “Is this a downward correction in a market that was overbought with the uptrend still intact, or is this rally over for the foreseeable future?” Let’s discuss…
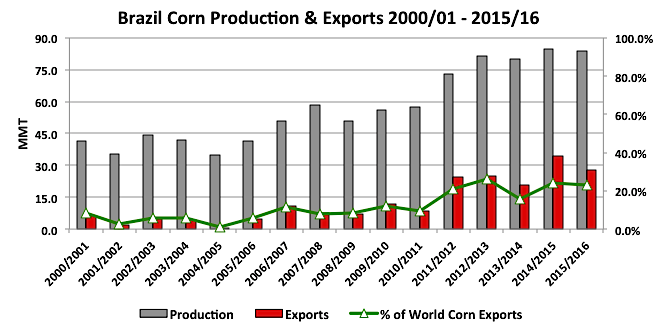
A host of notable Ag analysts attempted to attribute a percentage of the recent strength in corn futures to weather concerns in central Brazil, where the focus had been on the persistence of hot and dry temperatures and the negative impact this was having on the country’s safrinha corn crop (which accounts for approximately 67% of total Brazilian corn production). Those fears were further stoked on Tuesday after Brazil’s government chose to eliminate a 10% import tax on corn shipments from countries outside the Mercosur trade bloc for a period of 6 months (or up to a maximum of 1 MMT; 39.4 million bushels). The market signal was twofold in that it immediately led to speculation that Brazil was positioning short-term to import U.S. corn. And secondarily, given Brazil’s current standing as the world’s 2nd largest corn exporter, questions arose as to the possibility of a material reduction to Brazil’s 2015/16 corn export forecast of 28 MMT in the USDA’s May 2016 WASDE report. Conversely, Brazil’s loss appeared to be the U.S.’s gain with these developments suggesting, at least on the surface, that a much needed boost to U.S. corn export sales was in the offing.
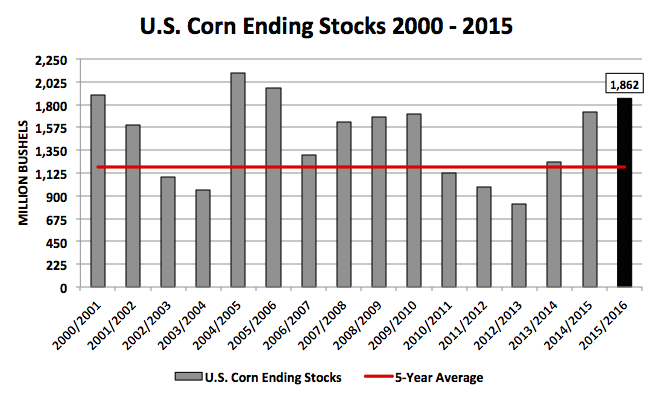
HOWEVER, as the market really started to dig into the real versus imagined bushels at risk in Brazil, total production estimates were still coming back at largely no less than 82 MMT versus the USDA’s April forecast of 84 MMT. What then would be the impact of a 2 MMT or 78.7 million bushel decrease in Brazilian corn production? It would be extremely limited with U.S. 2015/16 corn ending stocks still tracking at a 10-year high of 1,862 million bushels and World corn stocks reported at a record high of 208.9 MMT earlier this month. This revelation seemed to dismiss the significance of the “drought” and at a minimum expose the false narrative that a substantial percentage of bushels were being lost in the largest safrinha corn producing states of Mato Grosso and Parana.
On Thursday, the USDA’s Weekly Export Sales report further reinforced that despite all the hypotheticals surrounding lower Brazilian corn production, U.S. corn exports were still running 11.5% behind a year ago. That percentage versus the 1,864 million bushels of U.S. corn exported in 2014/15 equated right back to the 1,650 million bushel forecast the USDA last projected in the April 2016 WASDE report. This storyline has since seemed to lose most of its momentum, especially in light of Thursday and Friday’s complete collapse in December corn futures.
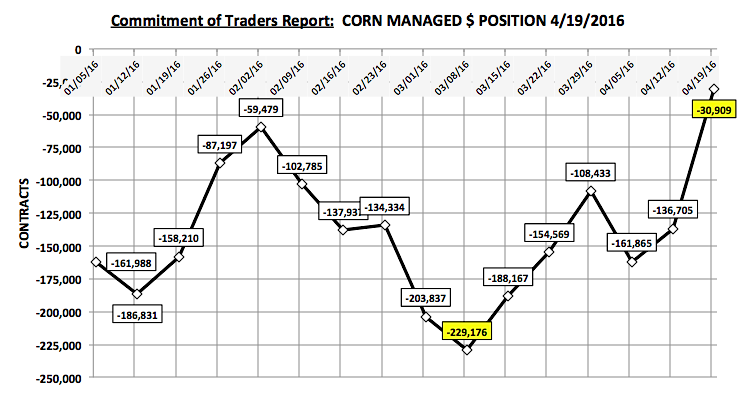
If the “drought” in Brazil wasn’t the central force in the corn rally then what was the primary price driver? Friday’s freefall in corn (and soybean futures) seemed to cement the view I’ve held since CZ6 closed sharply higher on 4/13/16. This rally was literally all about the Benjamins. I spoke at length in my last column regarding the shift in the Managed Money position in soybeans from March 1st through the market close on April 19th with money managers’ net buyers of +216,868 contracts. In corn a similar pattern in money flow developed with the Managed Money position moving from a net short of -229,176 contracts on March 8th to a net short of just -30,909 contracts on April 19th (suggesting money managers had been buyers of 198,267 contracts over that 6-week time period). Traders will now have to wait until 4/29 to see what effect Thursday and Friday’s sell-off/key reversal had on those positions; however based on the price action to finish the week, the strong assumption can be made that the money has now shifted aggressively from buyer to seller.
That said can corn futures recover early next week? Based on the technical damage done to the December corn chart on 4/22 I believe it’s going to be difficult. December corn futures closed below nearly all the key moving averages on Friday including the 200, 100, 50, and 35-day moving averages (see chart on page 3). To sustain any sort of momentum holding those key support levels was essential. Furthermore there is still no compelling or substantive fundamental justification for corn futures to rally at this time with the 2016 U.S. corn planting pace well ahead of the 5-year average and 2016/17 U.S. corn carryin stocks still likely to exceed a very comfortable 1,800 million bushels. Therefore without an active Managed Money buying presence both corn and soybean futures could easily continue to grind lower into the month of May.
At the end of the day, this “major” rally in corn consisted of just 45-cents from the day low of $3.64 on 4/1 to the day high of $4.09 on 4/21, and even that required a massive amount of Managed Money buying. This alone speaks to how much old-crop corn the U.S. farmer still has and needs to move/price sometime prior to the 2016 U.S. corn harvest. Therein lies the continued cash offset (by way of commercial hedge/sell paper) to even substantial quantities of buy paper from money managers. Ultimately, until there’s a reason for the producer to question the size of his/her 2016 corn crop, they’re going to continue selling even minor up moves in the market, which inherently limits the CZ6’s upside potential.
Thanks for reading.
Twitter: @MarcusLudtke
Author hedges corn futures and may have a position at the time of publication. Any opinions expressed herein are solely those of the author, and do not in any way represent the views or opinions of any other person or entity.
Data References:
- USDA United States Department of Ag
- EIA Energy Information Association
- NASS National Agricultural Statistics Service


