 The corn market was inundated this week with reports from the Pro Farmer Midwest Crop Tour. As always the colorful, first hand accounts of US corn and soybean conditions varied from not only state-to-state but also county-to-county. The market focus going into the tour was distinctly on the Eastern Corn Belt given its well-documented challenges this growing season with excessive springtime rains. Those concerns were largely validated with consultants observing adequate plant populations; however shorter grain lengths, which in turn resulted in yield estimates substantially lower than a year ago in Illinois, Indiana, and Ohio.
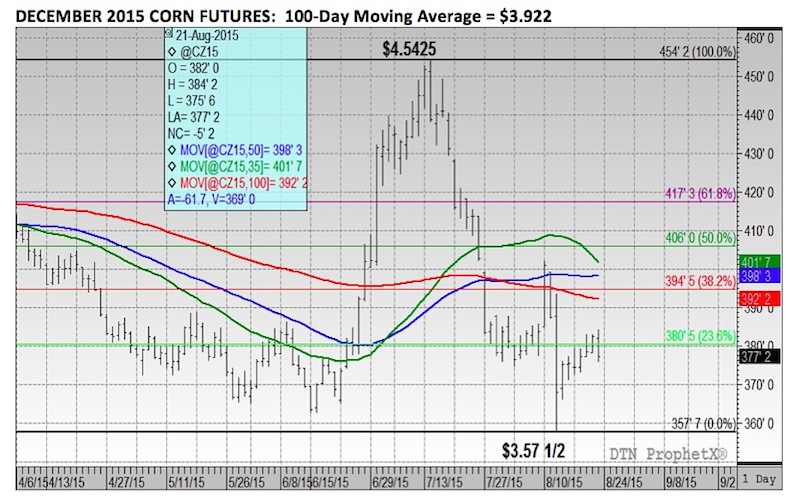
That said, in my opinion, the results from the tour didn’t provide any new or sustainable bullish revelations. If anything Pro Farmer’s yield samplings seemed to authenticate a number of the USDA’s August yield projections, which already contained yield estimates down 14% versus 2014 in Illinois (-28 bpa), down 16% in Indiana (-30 bpa) and down 5% in Ohio (-8 bpa). The corn market also appeared to be somewhat uninspired by the tour’s findings with December corn closing up just 1 ¾-cents per bushel week-on-week at $3.77 ¼.
Therefore, the disappointment for Corn Bulls might have been that after examining closely the tour’s results there wasn’t enough data offered to suggest the USDA was substantially over-estimating corn yield potential in the August Crop report. I felt strongly that if there was a smoking gun it would have been discovered in Illinois. Pro Farmer’s Crop Tour sampling offered an average corn yield for Illinois of 171.64 bpa. The USDA’s yield projection for Illinois in August was 172 bpa. That said I’m not suggesting that state corn yields in Illinois, Indiana, or Ohio won’t come down in proceeding Crop reports; however where my opinion has shifted is that I’m no longer anticipating additional yield declines in excess of 10% in any of those three states.
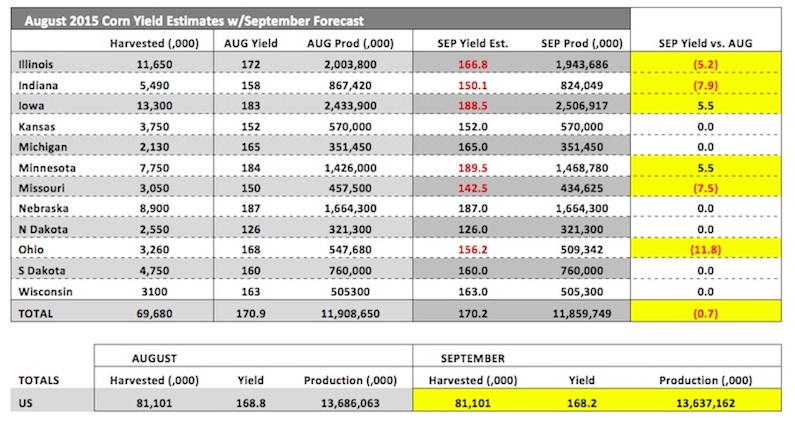
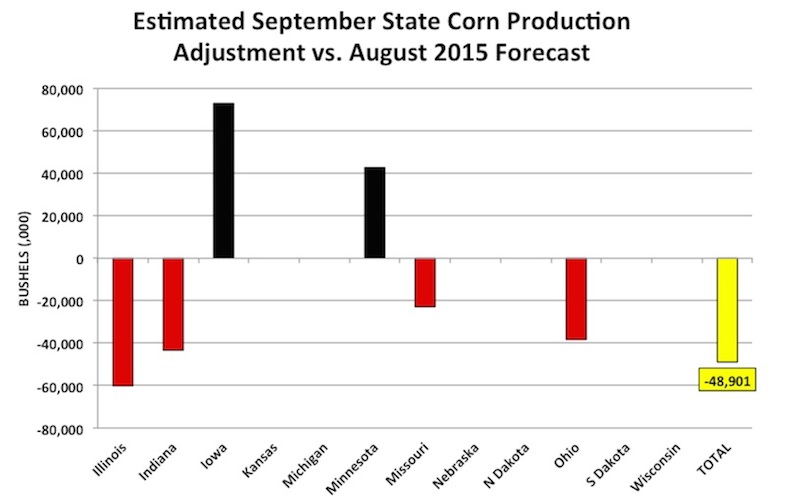
My latest state-by-state corn yield modeling for the September Crop report (released on 9/11/15) assumes a 3% yield decline in Illinois (166.8 bpa), 5% in Indiana (150.1 bpa), 5% in Missouri (142.5 bpa), and 7% in Ohio (156.2 bpa) versus the USDA’s August estimates. I also incorporated 3% yield increases for Minnesota (189.5 bpa) and Iowa (188.5 bpa). After making those adjustments the net impact on total US corn production is just -48.9 million bushels compared to the USDA’s August US corn production forecast of 13,686 million bushels. The US corn yield decline equates to 168.2 bpa versus 168.8 bpa in August. And therein lies the problem for the remaining corn longs in the market. I’m not convinced even additional yield decreases in those four states will be enough to significantly swing the US S&D balance into a position where a sharply higher price floor is either required or justified. What if harvested acreage falls 500,000 acres as some are anticipating? That type of acreage figure would only lower US corn production 129 million bushels versus a 168.2 bpa yield, which suggests a US 2015/16 carryout of 1,584 million bushels.
Can December 2015 corn futures rally back to $4.50 a bushel?
Recent history has shown that the average “crop year” spot corn futures price (September 1st – August 31st) when US corn ending stocks were greater than 1,600 million bushels was $4.12 per bushel (2007/08, 2008/09, 2009/10, 2014/15, and 2015/15). On the converse, when US corn ending stocks were less than 1,100 million bushels the average spot corn futures price was $6.07 per bushel (2010/11, 2011/12, 2012/13, 2013/14). Based on this analysis, clearly rallies back to $4.00 CZ5 are still certainly in play this fall; however to truly generate interest from the “managed money” players the US corn carryout would likely have to fall back down into the sub-1,200 million bushel range over time.
Assuming the USDA holds 2015/16 US corn demand relatively static through the end of calendar year 2015 at 13,775 million bushels, the US corn yield would need to drop to 163.4 bpa or lower (on 80.601 million harvested acres) to push US corn ending stocks under 1,200 million bushels. Is a 5.4 bpa yield decrease versus the USDA’s August forecast of 168.8 bpa possible between now and the November Crop report? I certainly wouldn’t rule it out; however I believe it’s now going to require actual harvest results or an early frost/freeze event, which invariably means a sustainable rally could be postponed until last half September – first half October.
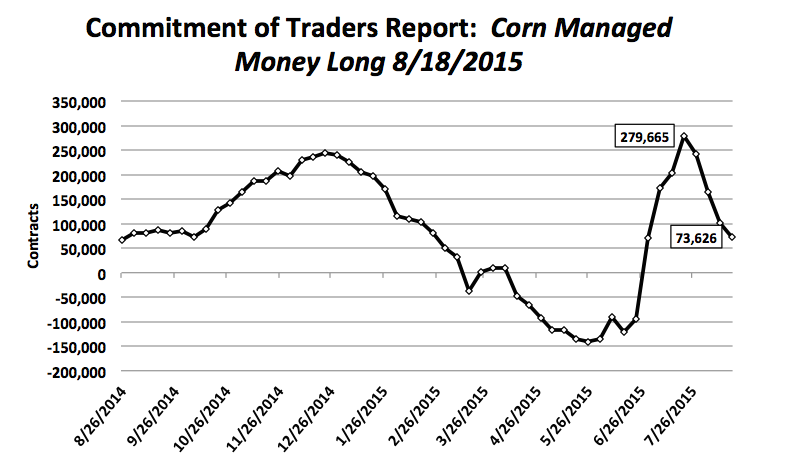
What’s the more immediate problem for Corn Bulls? Friday’s Commitment of Traders report showed the managed money corn longs falling to just 73,626 contracts as of August 18th, which is down more than 206,000 contracts from July 21st. Clearly the “money” is losing interest and without active managed money participation 50 to 80-cent rallies are historically very hard to come by.
Thanks for reading and have a great week.
Twitter: @MarcusLudtke
Data References:
- USDA United States Department of Ag
- EIA Energy Information Association
- NASS National Agricultural Statistics Service
Any opinions expressed herein are solely those of the author, and do not in any way represent the views or opinions of any other person or entity.


