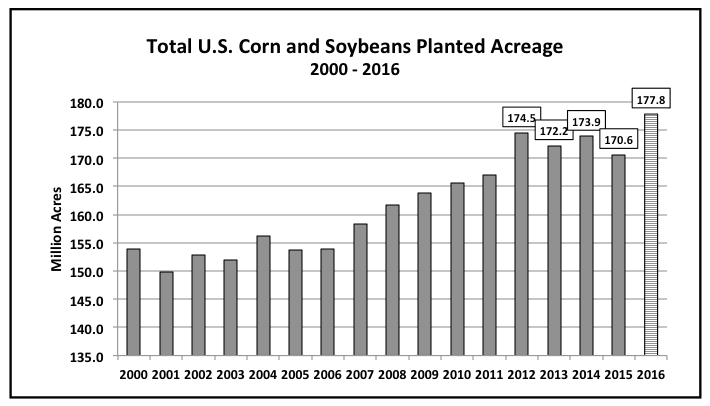
This week I spent time analyzing the dramatic increase in U.S. corn and soybean planted acreage, which really started in 2012. That spring total U.S. corn and soybean planted acreage exploded to a record high of 174.5 million acres.
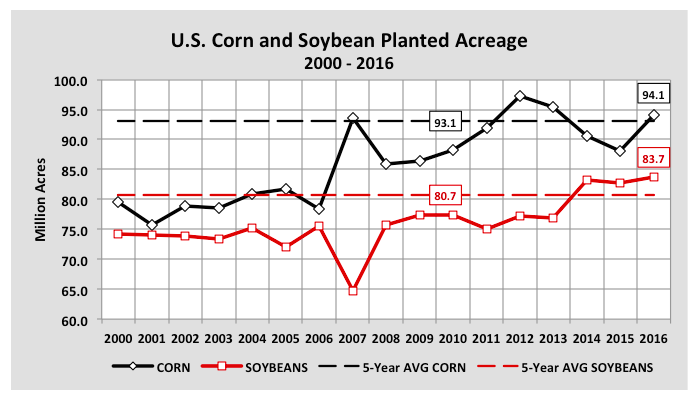
Corn planted acreage increased to 97.3 million acres, the largest it had been since 1936 (102 million acres). Soybean planted acreage totaled 77.2 million, which at that time represented the 3rd largest U.S. soybean planted acreage base in history. From a futures price perspective, the incentives to expand acreage were undeniable with CME spot corn futures averaging $6.95 per bushel and spot soybean futures averaging $14.66 per bushel in 2012.
That said flash forward to present. This spring U.S. farmers planted a new record 177.8 million corn and soybean acres; however in a stark contrast to 2012, the CME spot futures prices for corn and soybeans have thus far averaged $3.66 and $9.87 per bushel respectively. This begs the question, “Where’s the economic incentive to continue planting +90 million corn acres and +80 million soybean acres?”
I’m not sure I see can see one unless farmers are guaranteed extraordinarily high yields to compensate for the sharp reduction in prices. Even then however, the problem of lower prices only perpetuates itself with carryout levels in both commodities continuing to rise.
Therefore at some point I do think farmers have to respond to the drop in gross revenue per acre with a material downward adjustment in planted acreage. I believe strongly this is the type of setup producers need during the March/April timeframe to create sustainable summer rallies versus what farmers once again experienced this growing season, which was in 2016 a market that never recovered once the risk of a La Niña was eliminated.
If we were to consider that had farmers planted 90 million corn acres this spring (vs. 94.1 million) and 80 million soybean acres (vs. 83.7 million), even with August’s record yield projections included for both crops (175.1 bpa for corn and 48.9 bpa for soybeans), U.S. corn production would be 700 million bushels lower than it was forecasted in August with U.S. soybean production down approximately 200 million bushels. This would have resulted in 2016/17 U.S. corn ending stocks of approximately 1,700 million bushels (vs. 2,409 million) and soybean ending stocks of 130 million bushels (vs. 330 million).
There’s little doubt those types of carryout figures would demand a substantially higher floor price in both corn and soybeans versus today’s current pricing environment.
As the market looks ahead to 2017…I have to believe producers (and their lenders) will take a good hard look at making adjustments to their future acreage mix with a “less is more” approach one possible outcome. The fact remains that while producers can’t control the weather, they can control how many acres they plant and both have a significant impact on prices.
Thanks for reading.
Twitter: @MarcusLudtke
Author hedges corn futures and may have a position at the time of publication. Any opinions expressed herein are solely those of the author, and do not in any way represent the views or opinions of any other person or entity.
Data References:
- USDA United States Department of Ag
- EIA Energy Information Association
- NASS National Agricultural Statistics Service


