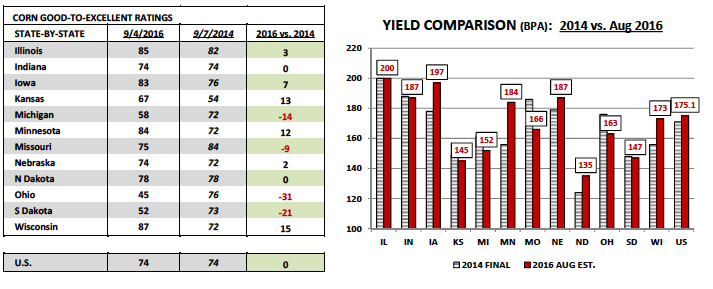
In Monday’s Weekly Crop Progress report the USDA lowered its good-to-excellent rating in corn 1% to 74%, equal to 2014’s rating as of September 7th.
All of the focus in corn remains on yield. Therefore Monday’s corn ratings decline, albeit it just 1%, did not go unnoticed by the market. Both Informa and FCStone raised their September U.S. corn yield forecasts to 174.8 bpa and 175.6 bpa respectively. Clearly, the expectation is that the USDA will NOT lower its national corn yield in the September WASDE report (which will be released on Monday, September 12th, 2016).
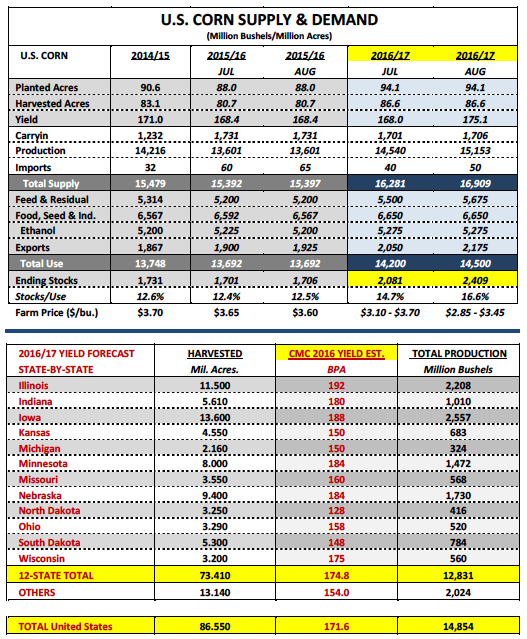
In August the USDA issued a U.S. corn yield forecast of 175.1 bpa, which at the time was 4.5 bpa ABOVE the average trade guess. Since then the market’s had the opportunity to digest data from a large cross-section of field samples via the Pro Farmer Midwest Crop Tour. The vast majority of those samples seemed to indicate good to very-good corn yields in a number of key growing states; however not necessarily record corn yields. That said I remain of the opinion that the final U.S. corn yield reflected in the January 2017 WASDE report will be much closer to 171.6 bushels per acre (my state-by-state yield estimates are on page 2), which if realized would equate to total U.S. corn production of 14,854 million bushels versus the USDA’s August estimate of 15,153 million bushels (-299 million).
WHAT ARE THE KEY SWING STATES ON THE U.S. CORN YIELD?
The two major swing states are still Iowa and Illinois (the two largest corn growing states in the country), which collectively account for approximately one-third of total U.S. corn production. In August the USDA estimated Illinois’s corn yield at 200 bpa, equal to its record yield established in 2014. Iowa’s corn yield was forecasted at 197 bpa, 5 bpa ABOVE its record yield established in 2015. Conversely Pro Farmer after analyzing the results from its recent crop tour issued yield estimates for Illinois and Iowa of 194 bpa and 193 bpa respectively. And while at face value Pro Farmer’s projections don’t appear to be significantly different than the USDA’s August estimates, after factoring in the multiplier effect on a combined 25.1 million harvested corn acres, the minor yield adjustments effectively lower total U.S. corn production 123.4 million bushels.
AVERAGE TRADE GUESSES FOR THE SEPTEMBER WASDE REPORT
The average trade guesses for the September 2016 WASDE report are as follows:
- U.S. corn yield 173.4 bushels per acre versus the USDA’s August estimate of 175.1 bpa and 168.4 bpa last year
- U.S. corn production 15,027 million bushels versus the USDA’s August estimate of 15,153 million bushels and 13,601 million last year
- U.S. corn ending stocks 2,329 million bushels versus the USDA’s August estimate of 2,409 million and 1,706 million last year
- Additionally over the last 10 years the USDA has increased the U.S. corn yield (versus August) 6 times by an average of +2.5 bpa; the 4 yield decreases averaged -2.3 bpa
The argument for a September yield decrease this year is centered on the belief that the 2016 harvest will eventually show lower ear weights. As of Monday’s Weekly Crop Progress report 18% of the U.S crop was rated “mature” versus the 5-year average of 20%. Therefore we’re still a few weeks away from getting “harvest” results, which means if indeed this year’s U.S. corn yield is closer to 170 to 172 bpa the market likely won’t know or see this reflected on paper until the October and/or November WASDE reports.
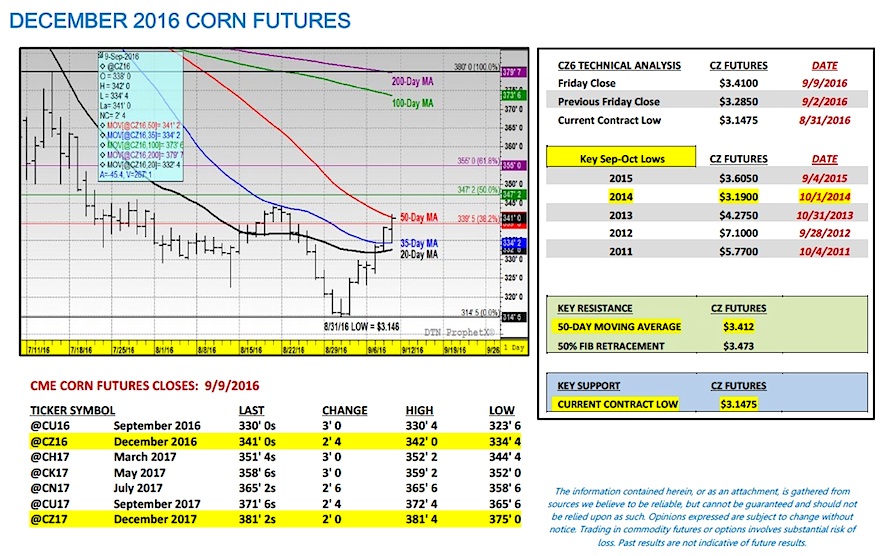
Price Forecast – December Corn Futures
December corn futures managed an impressive 12 ½-cent higher weekly close, finishing on Friday at $3.41. What was even more remarkable however was CZ6’s ability to push through and close above the 35-day moving average of 3.34 ¼. December corn futures had not traded above the 35-day moving average since June 21st. That said as the market shifts its attention to next week, and in particular, Monday’s release of the September 2016 WASDE report, continued rallies above $3.41 to $3.47 will likely prove difficult. From a technical perspective, the 50-day moving should provide immediate overheard resistance at $3.415 with $3.47375 representing the 50% Fibonacci retracement from the July 14th high of $3.80 versus the August 31st low of $3.14 ¾.
What are the two most Bearish price drivers going into Monday’s trading session?
- The 5 and 10-year price seasonals both turn aggressively lower on or near September 12th through the end of the month. This pattern is not the least bit surprising given the proximity of harvest, which brings with it increased commercial hedge (selling) pressure.
- The September 2016 WASDE report, even if it reveals a slight downward revision to the U.S. corn yield, both U.S. and World corn ending stocks will likely remain at extraordinarily high levels. For example, if the USDA drops the U.S. corn yield 2 bpa, total production would decline approximately 170 million bushels, lowering the U.S. corn carryout to 2,240 million bushels. There’s nothing price supportive about that type of ending stocks figure above $3.50 in December corn futures.
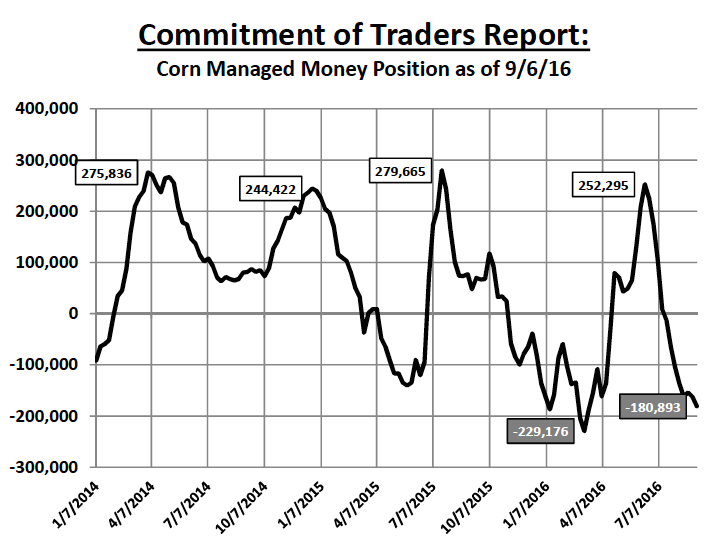
The one bullet for Corn Bulls remains the massive Managed Money net short, which grew to -180,893 this past week. If money managers look to cover that position…this could provide the bounce over the 50% Fibonacci retracement; however I still believe that will be viewed as a selling opportunity. A re-test of the current contract low of $3.14 ¾ into the end of the month remains a possibility.
Thanks for reading.
Twitter: @MarcusLudtke
Author hedges corn futures and may have a position at the time of publication. Any opinions expressed herein are solely those of the author, and do not in any way represent the views or opinions of any other person or entity.
Data References:
- USDA United States Department of Ag
- EIA Energy Information Association
- NASS National Agricultural Statistics Service


 Ready To Break Out?")


 Rolling Over At Key Fibonacci Level?")