Corn summary WEEK ENDING 6/3/2016:
As of Friday’s closes (6/3), December corn futures traded up 6 ¼-cents per bushel week-on-week, closing at a new 2016 calendar year high of $4.19 ¾.
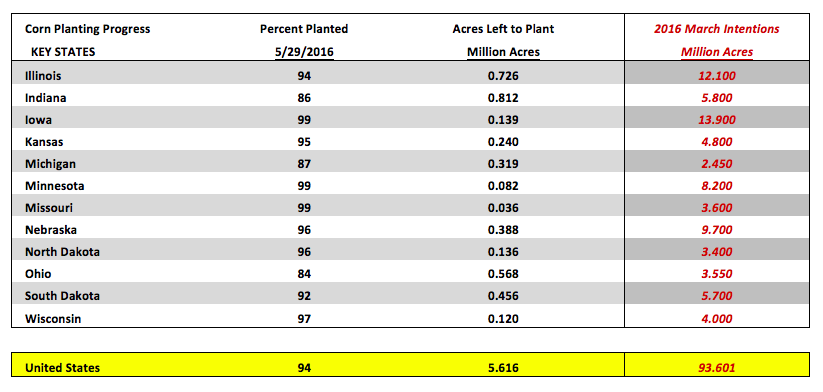
Monday’s Crop Progress report showed U.S. corn planting progress improving to 94% as of May 29th versus 94% in 2015 and the 5-year average of 92%. The pure percentages would suggest that 5.616 million corn acres remained unplanted in the U.S. with 2.106 million of that total coming in Illinois, Indiana, and Ohio. The question now is how many of those acres will still get planted to corn or will farmers switch to soybeans? And what does this say about current soybeans / corn fundamentals.
Two key factors that will influence those decisions are prevented planting dates and soybean/corn economics. The U.S. planting window for soybeans extends into the 2nd and 3rd week of June, whereas for corn a number of the state specific prevented planting dates for the top producers fall between 5/31 and 6/5. Secondarily, new-crop soybeans still technically hold a slight economic advantage versus new-crop corn with the SX6/CZ6 price ratio tracking close to 2.60, which historically favors planting soybeans. Ultimately however, the market won’t know any real adjustments to total U.S. corn and soybean planted acreage until the release of the USDA’s June 30th Acreage report. This report will contain revisions to the USDA’s March Prospective Plantings forecast of 93.901 million corn acres and 82.236 million soybean acres.
A few notable private analysts are now projecting 2016 corn acreage closer to 92.5 million acres (down 1.4 million) with soybean acreage increasing to 84.5 million (up 2.3 million). It should be noted that the largest March to June acreage decrease in corn over the last 10-years was -926,000 acres in 2010. In soybeans, and even more recently, in 2014 soybean planted acreage increased an impressive +3.346 million acres from March to June (81.493 million versus 84.839 million). Therefore as it stands currently neither private acreage adjustment for corn or soybeans appears unrealistic.
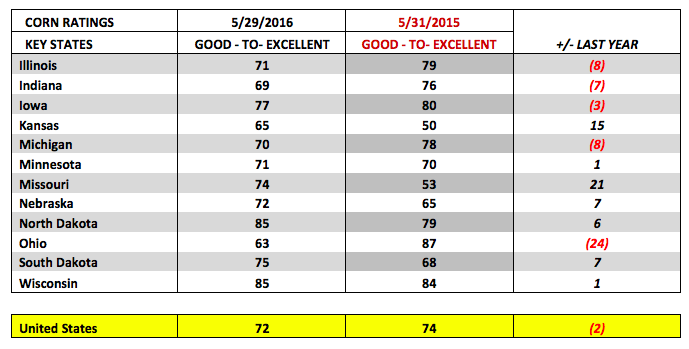
On Monday the USDA also released its initial crop condition rating for corn. The trade was anticipating a good-to-excellent rating from 70 to 73%. The USDA came back at 72% versus 74% a year ago. I’ve often questioned the validity of the USDA’s ratings system, which relies entirely on “visual observations” from approximately 4,000 respondents. These respondents then offer subjective estimates on the condition of the corn crop. Clearly there is some value in getting a general sense of how the corn crop is progressing across key sections of the Corn Belt; however I would argue there is no strong correlation or identifiable trend linking a national corn rating to a specific yield. In fact if you look at the final good-to-excellent ratings for all the years where the U.S. corn yield has exceeded 160 bpa here’s what you’ll see:
- 2004/05 Final U.S. Corn Yield 160.3 BPA; Final Good-to-Excellent Rating 75% (10/17/2004)
- 2009/10 Final U.S. Corn Yield 164.4 BPA; Final Good-to-Excellent Rating 70% (10/18/2009)
- 2014/15 Final U.S. Corn Yield 171.0 BPA; Final Good-to-Excellent Rating 74% (10/18/2014)
- 2015/16 Final U.S. Corn Yield 168.4 BPA; Final Good-to-Excellent Rating 68% (10/18/2015)
Key takeaways: Last year’s final good-to-excellent rating of 68% was the lowest of the four crop years listed and yet the yield was the 2nd highest ever. The final percentages would also suggest that essentially the same good-to-excellent rating (2004/05 and 2014/15) can equate to a yield variance of over 10 bpa, which based on 2016/17 harvested corn acreage of 85.9 million acres, would result in a production swing of 859 million bushels (6% of total 2016/17 U.S. corn production).
And finally, how meaningful are early growing season corn ratings for each specific state? Last year on May 31st Ohio enjoyed a good-to-excellent rating in corn of 87%, the highest of any of the top-12 corn producing states in the U.S. By the end of the growing season, Ohio’s corn rating had fallen to just 51%, which culminated in a final state yield of 153 bpa, 22 bpa BELOW its prior 2-year average of 175 bpa. For all of these reasons, and based on the subjectivity of the analysis itself, I’ve often made trading decisions independent of the USDA’s weekly crop condition ratings. However they do tend to move the market from week-to-week, which invariably forces traders to still account for them as it relates to their net position exposures.
What possible corn and soybean S&D adjustments might we see in the USDA’s June 10th WASDE report?
- 2016/17 U.S. Corn S&D Adjustments: I do NOT expect any changes to be made to the U.S. corn yield or planted acreage. Only 3 times in the past 12 years has the USDA adjusted the corn yield in June, all decreases averaging -2.8 bpa (largest decrease was -5 bpa in 2008/09). However given the USDA’s strong initial good-to-excellent rating in corn of 72%, I would view a June yield decline as highly unlikely for 2016. Furthermore I fully expect the USDA to differ any planted acreage adjustments to either corn or soybeans until the June 30th Acreage report. I am however expecting a decrease to carryin stocks of at least 50 million bushels, as well as, a 50 million bushel increase to exports, which would then theoretically lower 2016/17 U.S. corn ending stocks to 2,053 million bushels.
- 2016/17 World Corn S&D Adjustments: I expect World corn ending stocks to fall as much as 2 MMT versus a month ago to approximately 205 MMT. 2015/16 Brazilian corn production has privately been estimated as low as 76 MMT (Informa at 78.9 MMT) versus the USDA’s May forecast of 81 MMT. This should result in lower 2016/17 World carryin stocks. Additionally if the 2016/17 U.S. corn carryout drops 100 million bushels, this invariably will also have a significant impact on World stocks considering the U.S. accounts for approximately 26% of that total. Keep in mind however; a World corn carryout in excess of 200 MMT has only been achieved 2 other times in history. Therefore from a fundamental standpoint, there’s still nothing Bullish in my opinion regarding a 2 to 3 MMT decrease in World corn stocks considering the May forecast was 207.04 MMT.
CZ6 CORN FUTURES PRICE FORECAST:
December corn futures (CZ6) have now closed 20-cents higher since the close on May 20th. Friday’s day high of $4.20 matched a key high on October 7th, 2015, raising the possibility of a Double Top being formed. That said it sure doesn’t feel like Money Managers are done adding to their existing long positions. Friday’s Commitment of Traders report showed the Managed Money long in corn growing 66,102 contracts week-on-week to +130,798. That does not include any additional longs purchased from Wednesday through Friday.
continue reading on the next page…


