CORN MARKET SUMMARY FOR WEEK ENDING 4/8/2016:
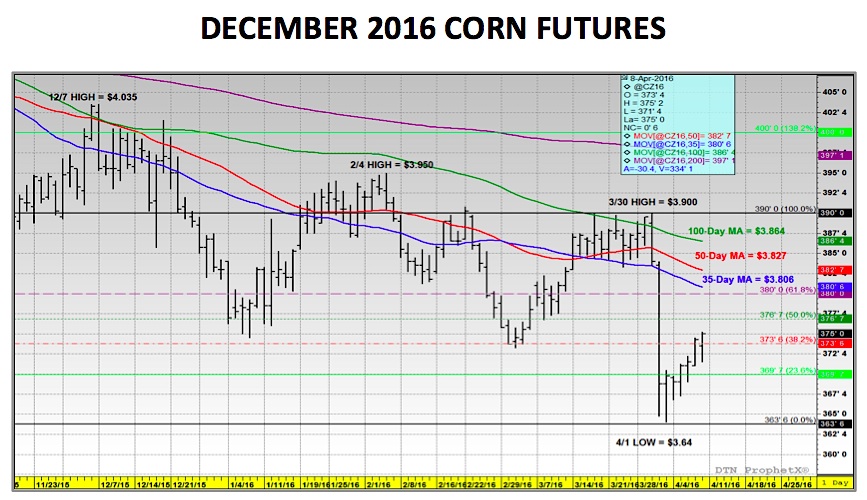
Now What? That was the question on everyone’s mind this week regarding trying to anticipate corn futures next move post-March 31st Prospective Plantings and Grain Stocks reports. Last Friday, December corn futures finished the week recording a new contract low of $3.64. This break to new lows was once again a byproduct of the USDA’s March 2016 planted corn acreage forecast of 93.6 million acres, which was 3.6 million acres ABOVE the average trade guess and resulted in CZ6 closing down 15 ¼-cents per bushel on 3/31. Therefore walking in Monday morning I found myself in the camp of those traders essentially waiting and watching to see how December corn futures would respond.
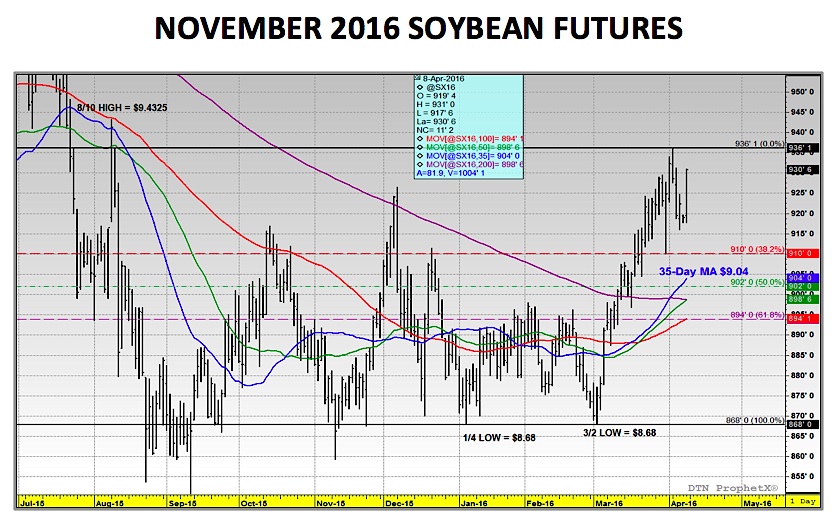
Would the acreage number prove too much to overcome for even the most ardent Corn Bulls? Or would the corn market somehow latch onto lingering support in the soybean complex, which saw November soybeans score a new contract high on the same day December corn was in the process of carving out its new contact low?
Five full trading days later I’m still not sure I can answer that question. December corn futures at least for a week managed to resist retesting the $3.64 CZ6 price level, closing on Friday at $3.75. However how long that can last remains in doubt given what the corn market did the last two years under a similar fundamental backdrop. Let’s consider the following:
2016 U.S. Corn Fundamental Similarities WITH 2015 and 2014
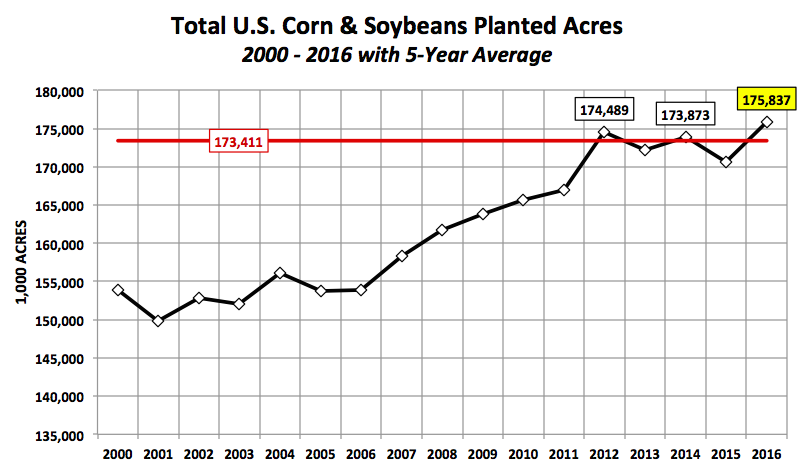
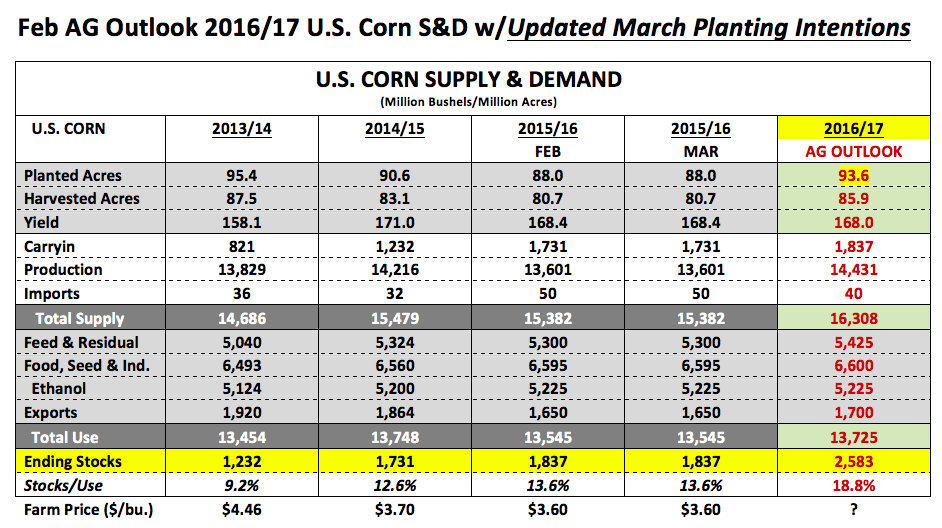
- 2016 U.S. corn planted acreage is forecast at 93.6 million acres, which is notably higher than 2015 final corn planted acreage of 88.0 million and even the 90.6 million corn acres planted in 2014.
- Furthermore, 2016 U.S. corn carryin stocks as of the March WASDE report would total 1,837 million bushels, which is 106 million bushels higher than 2015 and 605 million bushels better than 2014.
- Why do acreage and carryin stocks have such a strong influence on spring price direction? If both U.S. corn planted acreage and carryin stocks are deemed sufficient, it immediately discounts the need for an early growing season (April through mid-June) weather premium in prices. Large acres and carryin stocks provide a built-in supply cushion, which in turn reduces some of the risk associated with 2016 corn yields possibly falling below-trend.
What Was The April – Mid-June CZ Price Action in 2015 and 2014?
- In 2014 from April 1st through June 17th December corn futures traded 66-cents lower (CZ close on 4/1/14 was $5.05 ½ versus $4.39 ½ on 6/17/14). The majority of that downward correction in price occurred after the 2nd week of May.
- In 2015 from April 1st through June 15th December corn futures traded 43 ¼-cents lower (CZ close on 4/1/15 was $4.06 ¾ versus $3.63 ½ on 6/15/15). The downward correction in price was fairly constant after the 1st week of April.
The reality is the 2016 U.S. corn S&D makeup is arguably now more Bearish than the previous two years. Does this mean December corn futures can’t or won’t rally? No. However what it does mean is that until the market is able to contemplate a verifiable summer weather threat (during pollination), it’s likely December corn futures won’t have much of a fundamental justification to stay supported even at current price levels.
What will it take for December corn futures to stay above $3.60 this spring (April through mid-June)?
There are 3 potential price stabilizers I’ve identified that could neutralize the “first impressions” market reaction to the 2016 U.S. corn fundamental outlook and corresponding negative 2-year price seasonal.
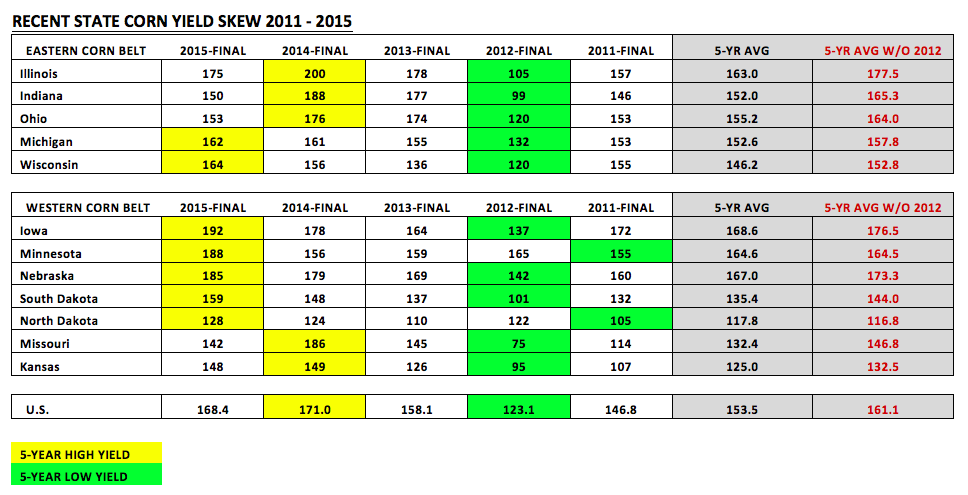
- The corn market is already trading at heavily discounted levels. The 2015 spring day low in CZ6 was $3.62 ½, which occurred on June 15th. This year December corn futures have already come within 1 ½-cents of that price level as of April 1st. It should be noted that December corn futures have not traded below $3.60 per bushel during the April through June timeframe since 2010. That same year (2010), December corn futures made a day low of $3.54 ½ on June 8th, and by November 9th CZ was making a new contract high of $6.03 ½. Therefore the argument could be made that CZ6 is getting ahead of itself to the downside with the entire growing season still largely a vast unknown. I included the 5-year state-by-state corn yields this week for the top 12-corn producing states to reinforce this point. Achieving back-to-back +168 bpa national corn yields remains the exception not the rule.
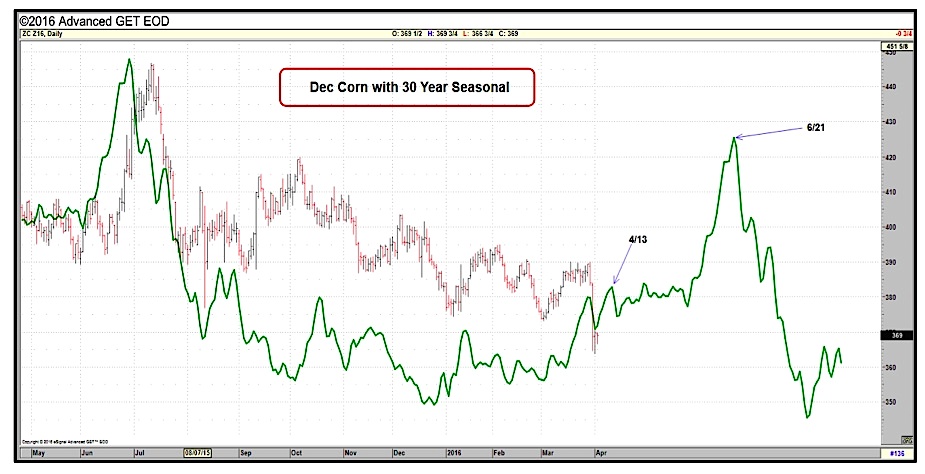
December Corn Futures – 30 Year Seasonality Pattern
- November soybean prices have the ability to influence (and support) December corn futures. I touched on this last week; however I would expect December corn to try and keep the SX6/CZ6 price ratio to something less than 2.65 (corn and soybeans are theoretically still competing for acres this spring; therefore a substantial shift in economics that favors one crop over the other could result in a material acreage shift from now until June 30th, which is when the USDA will issue revised 2016 planted acreage estimates). In 2015 from January 1st through approximately June 10th that ratio peaked at 2.53 on 5/11. In 2014 over that same period of time the high was 2.76 on 6/10. This would suggest that if November soybean futures stay supported at or near $9.25 this should limit CZ6’s downside to approximately $3.50 (applying a 2.65 SX6/CZ6 price ratio).
- Money managers are already carrying a large net corn short of approximately -162,000 contracts. The question to be asked if you’re a money manager is “What’s the additional downside opportunity with the aggregate Managed Money position already aggressively short and December corn futures trading under $3.80 per bushel?” As my previous two points alluded to there might be 20 to 30-cents per bushel of additional downside from now until mid-June; however is that a sufficient incentive if it requires adding to an already near record net short corn position and the entire growing season still upcoming? I feel fairly confident saying that if money managers hesitate on increasing their short corn position exposures, CZ6 has a decent shot of stabilizing. Why? Who else is going to sell it? The farmer’s not selling anything he/she doesn’t have to, which is apparent via the May-Jul corn spread (CN6-CK6) narrowing to under 3-cents per bushel this week. In theory that spread should be trading closer to 6 or 7-cents given the surplus March 1 corn stocks forecast of 7.81 billion bushels.
In closing…I still can’t get Bullish corn for any good reason at the moment; however (based on the previous 3 points) I can create a defendable argument for December corn futures to, at a minimum, pause before breaking sharply below $3.60 per bushel from now until mid-June. Thanks for reading.
Additional Charts for reference…
Twitter: @MarcusLudtke
Author hedges corn futures and may have a position at the time of publication. Any opinions expressed herein are solely those of the author, and do not in any way represent the views or opinions of any other person or entity.
Data References:
- USDA United States Department of Ag
- EIA Energy Information Association
- NASS National Agricultural Statistics Service


 Rolling Over At Key Fibonacci Level?")

