Corn and Soybean summary for the week ending 5/20/2016:
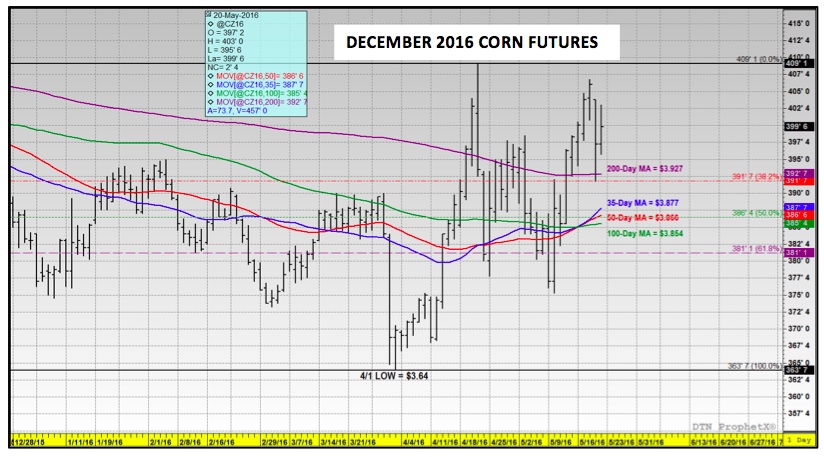
It was another week of largely sideways to slightly higher price action in corn futures with soybeans closing slightly lower. December corn futures closed up 1 ½-cents per bushel week-on-week, finishing on Friday at $3.99 ¾ per bushel. November soybean futures closed down 5-cents per bushel at $10.49 ½. Regardless of the lower close in soybeans, both markets continue to show firm underlying price support.
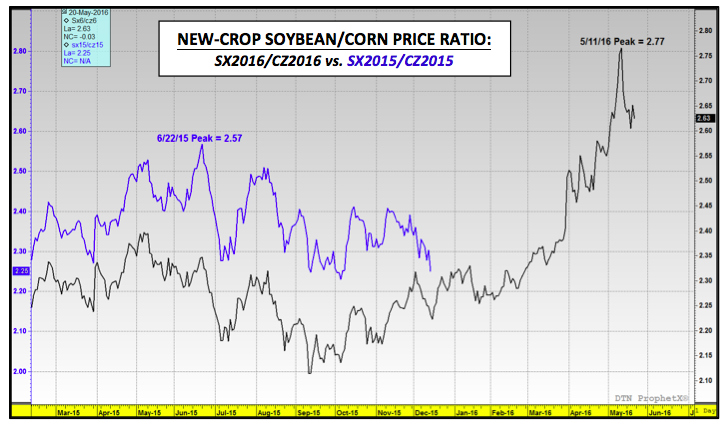
As expected December corn futures did gain on November soybean futures with the SX6/CZ6 price ratio closing at 2.63 on Friday afternoon after peaking at 2.77 on May 11th, which compares to the 2015 peak of 2.57 on June 22nd, 2015.
The supportive undertone in the market still appears to be directly correlated to the presumption of a La Niña establishing itself this July/August and bringing with it drought-like conditions to the U.S. Midwest. Count me in the minority of those who still believe it remains mildly premature going “all-in” on a summer drought forecast with the calendar reading May 20th and no imminent weather threats. That said from a Managed Money perspective I can understand the desire to get long both corn and soybean futures at essentially 5 ½-year futures lows (regardless of each commodity’s prospective fundamental outlook) even if the justification centers primarily on weather conjecture.
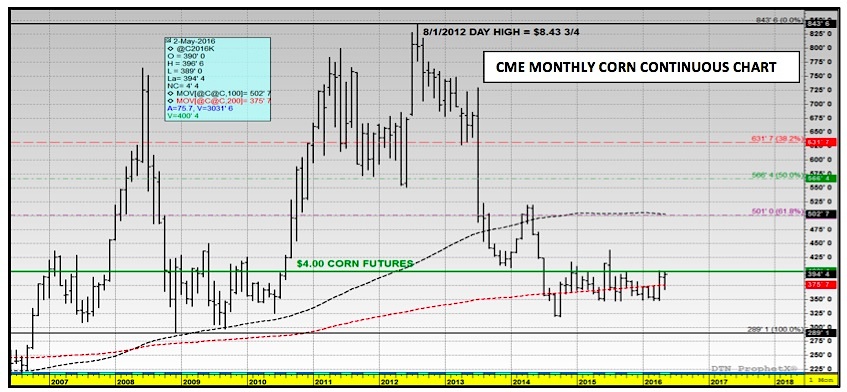
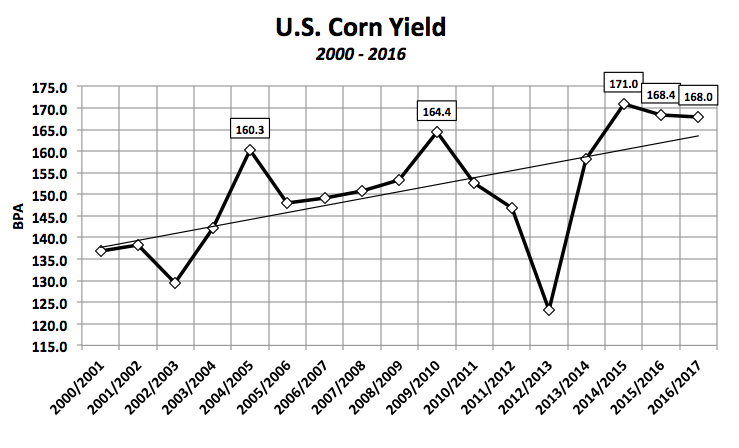
Purely from a futures pricing standpoint, the Monthly Corn Continuous chart shows the longevity of corn futures trading under $4.00 per bushel has been relatively short-lived in recent history. In fact at no time from September 2010 through June 2014 did corn futures trade under $4.00 per bushel. Furthermore this same chart (see page 2) would also suggest that corn’s downside risk even when breaching this $4.00 price threshold, and under record U.S. corn yield fundamental price pressure, has been limited to approximately $3.20 per bushel (in 2014/15 the U.S. achieved a record corn yield of 171 bpa, which resulted in CZ trading down to a day low of $3.18 ¼ on 10/1/2014). Conversely, the upside opportunity has proven itself to exceed $8.00 per bushel, as was the case in 2012 when the U.S. corn yield plummeted to 123.1 bpa (lowest U.S. corn yield since 1995/96’s 113.5 bpa). Therefore given current corn futures prices, if the risk is 80-cents per bushel of downside and the potential reward is $2.00 to $4.00 per bushel of upside, the Managed Money interest in adding long position exposures at or below $4.00 CZ6 appears defensible, notwithstanding the current forecast for 2016/17 U.S. corn ending stocks of 2,153 million bushels. Traders are well aware this carryout projection remains highly sensitive to future downward yield adjustments.
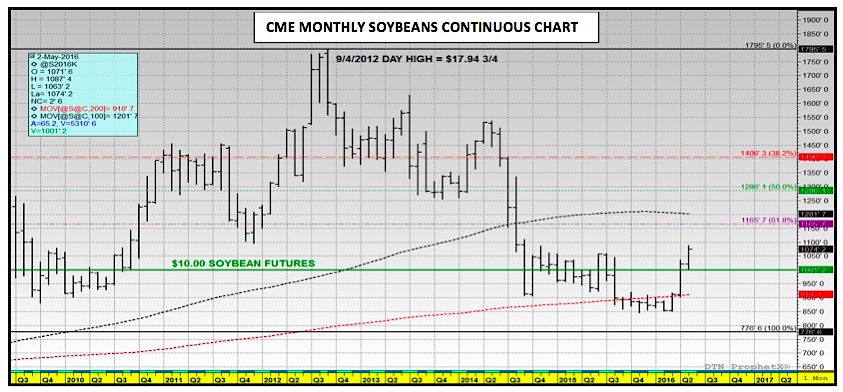
The Monthly Soybeans Continuous chart shows a similar dynamic with soybeans futures trading above $10.00 per bushel from September 2010 through June 2014. However when the U.S. soybean yield achieved a record high of 48.0 bpa in 2015/16, January soybean futures traded down to an approximate 6 ½-year day low of $8.44 ¼ on 11/23/15. Conversely in 2012, spot soybean futures traded up to within a dime of $18.00 per bushel on 9/4/2012. Therefore the risk/reward in soybeans (assuming prices are trading at $10.00 per bushel) appears to be $1.60 to the downside and $6.00 to $8.00 per bushel to the upside.
Furthermore, the upside opportunity in soybeans has thus far proven itself even more attractive following the USDA’s May 2016 WASDE report, which offered an initial 2016/17 U.S. soybean ending stocks projection of 305 million bushels, 95 million bushels below a year ago. Soybean Bulls have also been quick to point out the potential carryout ramification of just a 2 bpa decline in the national soybean yield versus the USDA’s current May estimate of 46.7 bpa. Theoretically this would push U.S. soybean ending stocks below 150 million bushels, which if realized would be approximately 40 to 45 million bushels less than the 2014/15 U.S. soybean carryout figure of 191 million bushels and just 50 million bushels higher than the 2013/14 U.S. soybean carryout of 92 million bushels. Traders are well versed on the price action in soybeans from the 2013/14 and 2014/15 crop years with spot soybean futures averaging $14.07 per bushel in 2013 and $12.44 per bushel in 2014.
December Corn Futures Chart
The challenge for U.S. corn and soybean producers is that while Managed Money investors can evaluate the pricing opportunities in both commodities strictly from an investment point of view (Risk/Reward), producers don’t have that luxury. They have to protect futures values that cash flow positively (which this rally has provided for some). Therefore while the allure of a repeat performance of the record setting price action from 2012 certainly remains enticing, the reality is, if this summer’s “drought” forecast is a bust both 2016/17 U.S. corn and soybean ending stocks are likely trending higher not lower versus the USDA’s initial May forecasts of 2,153 million bushels and 305 million bushels respectively.
continue reading on the next page…
Corn and Soybean Bulls have been quick to point out the “what-if’s” regarding future yield reductions. However an equally compelling case can be made to the downside (price breaks) if this year’s final U.S. corn and soybean yields come in slightly above trend-line.
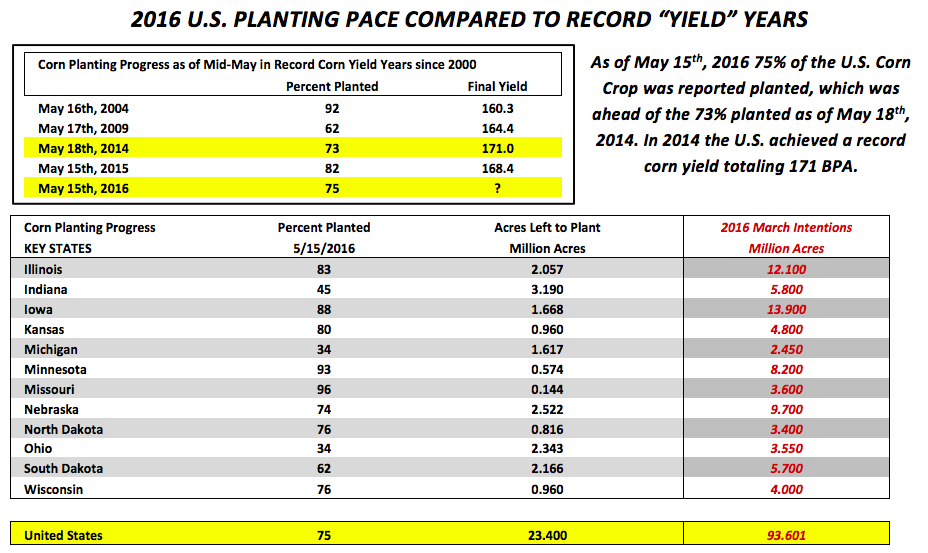
A 171 bpa yield in corn on 84.9 million harvested acres (down 1 million acres versus the March Intentions estimate) would push 2016/17 U.S. corn ending stocks over 2.2 billion bushels, representing the largest carryout since 1987/88. A 48 bpa yield in soybeans on 83.4 million harvested acres (up 2 million acres versus the March Intentions estimate) would push 2016/17 U.S. soybean ending stocks over 500 million bushels, which still incorporates the USDA’s current record demand forecast of 3,925 million bushels from the May WASDE report.
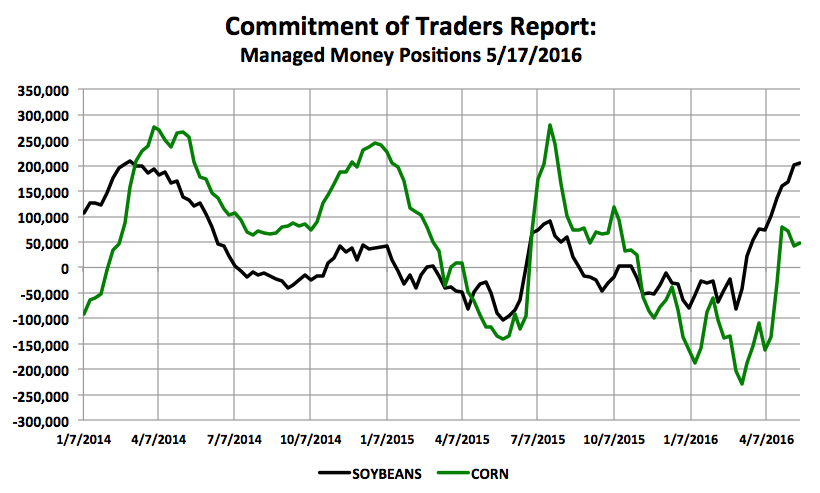
And finally, this week’s Commitment of Traders report showed the Managed Money position in soybeans moving up slightly week-on-week (+3,371 contracts) to +205,153 contracts. It remains the largest net long position money managers have carried in soybeans since March 4th, 2014 (+208,493 contracts). In corn the Managed Money position was reported at +48,978 contracts, up 6,009 contracts for the week. I do believe Money Managers will pause before adding aggressively to either position until more certainty can be offered regarding long-term (90-day) La Niña/weather prospects. For this reason alone, I’m still of the opinion that for producers specifically, additional upside risk/reward should be managed primarily with options.
Additional Charts & Insights
Thanks for reading.
Twitter: @MarcusLudtke
Author hedges corn futures and may have a position at the time of publication. Any opinions expressed herein are solely those of the author, and do not in any way represent the views or opinions of any other person or entity.
Data References:
- USDA United States Department of Ag
- EIA Energy Information Association
- NASS National Agricultural Statistics Service


