CORN WEEKLY SUMMARY: December corn futures ended Friday’s session 3 ¼-cents per bushel higher at $3.34 ¼. However, corn futures still managed to close down week-on-week 8 ½-cents. Needless to say, it was another difficult and frustrating week for Corn Bulls. Many are waiting for corn futures to show some measurable sign that prices are potentially carving out an intermediate bottom.
That said I was able to find at least one technically supported reason for optimism via the 5-year price seasonal, which suggests a bounce in corn futures is possible as early as next week.
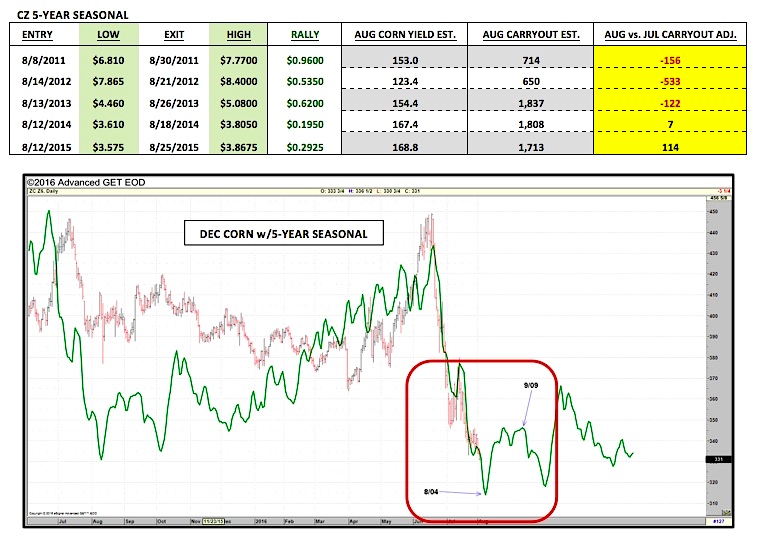
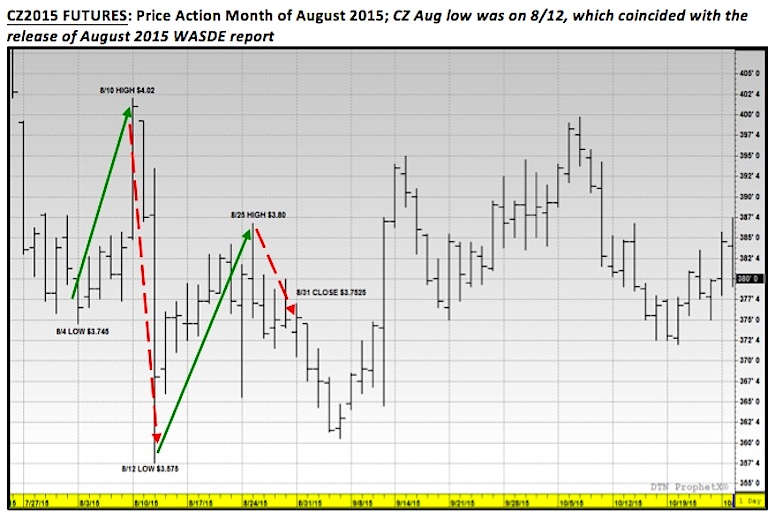
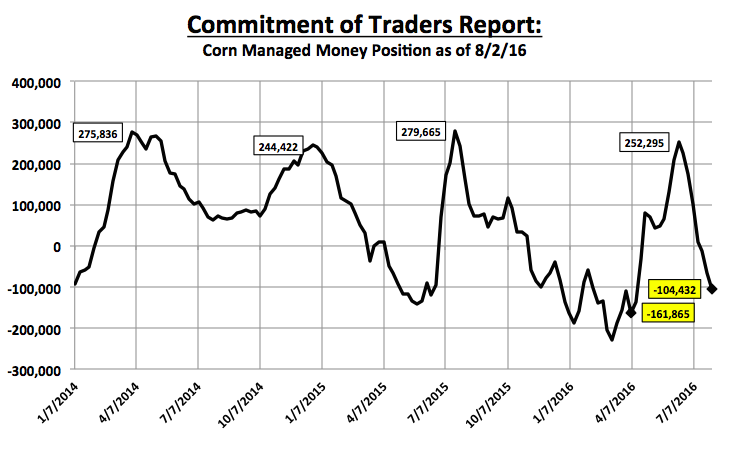
The data and seasonal chart below show that even in crop years 2014/15 and 2015/16, December corn futures rallied approximately 20 to 30-cents per bushel after 8/12. Note that both years featured record to near-record U.S. corn yields and higher U.S. corn carryout projections in the August WASDE report. The date is significant because of its correlation to this year’s release of the August 2016 WASDE report – and growing suspense over 2016 corn yield estimates. It is not uncommon for corn futures to sell-off into a major crop report on the assumption of Bearish U.S. yield and carryout S&D adjustments, only to then rally once those figures are actually published. I believe a similar pattern could evolve this year for the following reasons: 1) December corn futures recent, sustained weakness and 2) a growing COT Managed Money short position, which increased to -104,432 contracts as of August 2nd.
There were a couple notable private analysts issuing their U.S. corn yield and production estimates this week with the USDA’s 2016 August WASDE report scheduled to be released on August 12th. On Monday, FCStone projected a U.S. corn yield of 175 bushels per acre for total production of 15,146 million bushels versus the USDA’s July 2016/17 yield and production forecasts of 168 bpa and 14,540 million bushels respectively.
Informa Economics followed on Friday with a 2016 corn yield estimate of 169.8 bpa and total production of 14,694 million bushels. I believe the 5.2 bpa yield and 452 million bushel production variances between Informa and FCStone are fairly indicative of just how wide the range of opinions still are regarding the size of this year’s U.S. corn crop. Nearly everyone acknowledges it’s going to be a huge crop. However the question remains: “Just how big is it?”
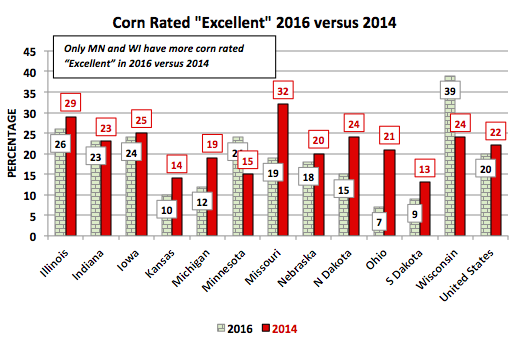
Last week I issued a U.S. corn yield forecast of 170 bpa for total production of 14,711 million bushels. Therefore I’m clearly more in-line with an Informa-like yield increase for the August WASDE report. That said with Monday’s Weekly Crop Progress report still showing this year’s U.S. corn crop rated 76% good-to-excellent, now 3% BETTER than 2014’s record-breaking growing season, I can understand the desire by some to jump to the conclusion that 2016’s final U.S. can yield will exceed 2014’s 171 bpa. HOWEVER, what doesn’t the Weekly Crop Progress report include that will have a substantial effect on the final 2016 U.S. corn yield? Crop ratings as I’ve stated in previous columns are extremely subjective, visual observations of the U.S. corn crop. What they can’t account for that only this year’s U.S. corn harvest can are corn ear fill, ear length/size, and plant populations. All 3 of those variables can swing the final U.S. corn yield 3 to 5 bpa, even on a crop rated as strongly as 2016’s.
CZ6 Price Forecast: I do expect a bounce in December 2016 corn futures as early as the release of the August 2016 WASDE report on Friday, August 12th, which would be similar to the price patterns established in both 2014 and 2015.
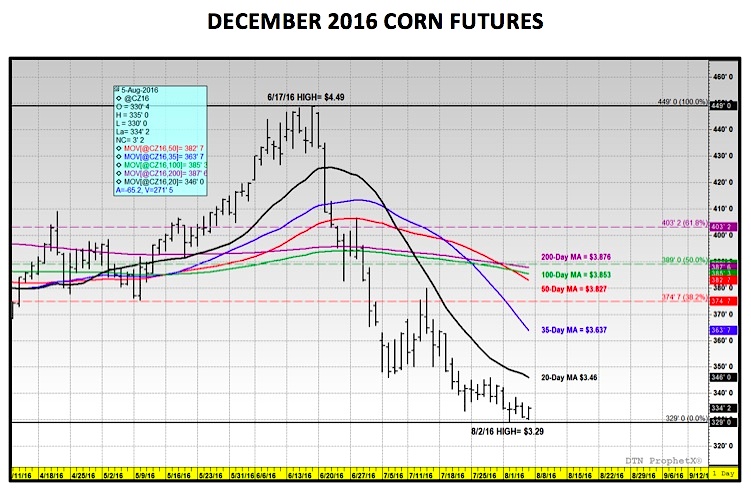
However the challenge will be trying to anticipate just how far corn futures can rally with the revised 2016/17 U.S. corn S&D likely to reflect a very burdensome forward view on U.S. corn ending stocks. Even with new-crop U.S. corn export sales off to a strong start (weekly sales totaled 35.3 million bushels in Thursday’s USDA Export Sales Summary) and the U.S. ethanol industry continuing to run at a record production pace (the July industry run-rate averaged more than 1.0 MMbpd), I don’t see enough of a total demand increase to offset increasing U.S. corn production. Therefore rallies back to $3.60 to $3.65 December corn futures could be the top end of any upward recovery in prices (note the 35-day moving average in December corn futures is $3.637 followed by the 50-day at $3.827). Additionally NOAA’s 6 to 10-day temperature and precipitation forecasts now show no signs of any extended heat or below-normal precipitation for the bulk of the Corn Belt into the August 12th through 16th timeframe. For these reasons alone, selling rallies (via selling outright futures, selling calls, or buying puts) even at levels below $3.70 CZ6 is still in my opinion warranted prior to September. The December 2014 corn futures chart still suggests that over time CZ6 could push lower than $3.20 per bushel, especially if November soybeans drift back into the low-$9.00 range. That said being disciplined enough to actually execute on that strategy, knowing intuitively a sale at $3.70 CZ6 is still nearly 80-cents removed from the June high, that will be the challenge…
Thanks for reading.
Twitter: @MarcusLudtke
Author hedges corn futures and may have a position at the time of publication. Any opinions expressed herein are solely those of the author, and do not in any way represent the views or opinions of any other person or entity.
Data References:
- USDA United States Department of Ag
- EIA Energy Information Association
- NASS National Agricultural Statistics Service


")