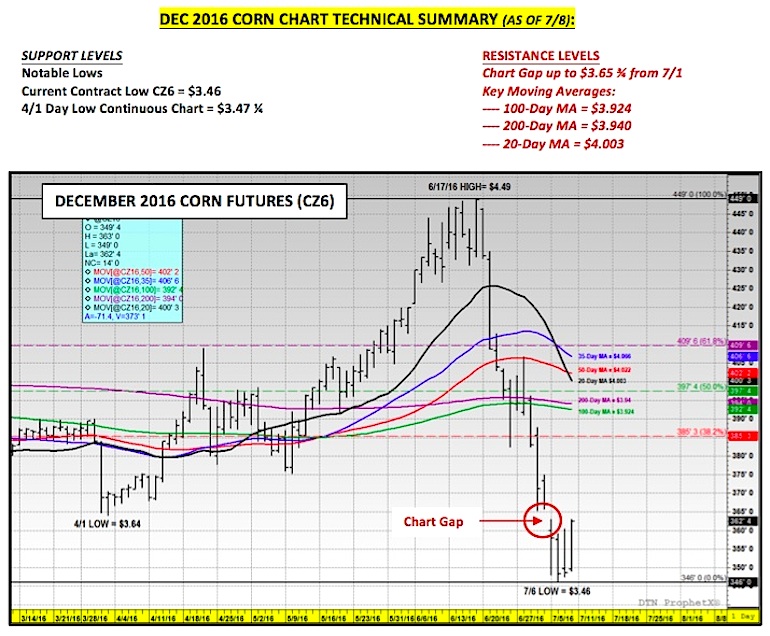
December corn futures closed down 4 ½-cents on the week, finishing on Friday at $3.62 ½. However Friday’s lower weekly close was also 16 ½-cents above Wednesday’s new contract low of $3.46. Therefore Friday’s trading session marked the first sign of a market potentially carving out an intermediate bottom. This would be a welcomed discovery for Corn Bulls who have been forced to endure a 23% downward correction in price of corn futures since the day high of $4.49 per bushel on June 17th. The selling pressure continues to be attributed to the lack of a discernible summer weather threat as evidenced by consistently strong corn good to excellent ratings and concerns over the size of the 2016 corn crop. Note you can also follow corn via the Corn ETF (NYSEARCA:CORN).
Monday’s weekly 2016 Corn Crop Progress report showed the U.S. national corn good to excellent ratings once again unchanged from the previous week at 75% versus 69% a year ago and 75% in 2014.
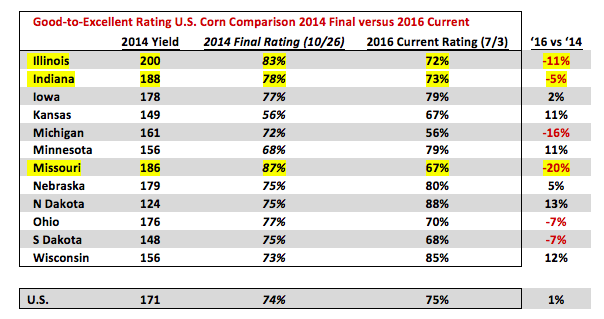
Michigan and South Dakota experienced the largest week-on-week declines with Michigan’s corn ratings down 7% to 56% good-to-excellent and South Dakota down 5% to 68% good-to-excellent. However of the top 4 largest state corn producers (Iowa, Illinois, Nebraska, and Minnesota) only Minnesota saw its corn ratings drop slightly, falling 2% on the week to 79% good-to-excellent. Overall, given the continued strong performance in corn ratings and existing ratings correlation to 2014 (final yield in 2014/15 was 171 bpa versus the USDA’s current 2016/17 estimate of 168.0 bpa), the market is heavily weighing the possibility of the USDA increasing the U.S. corn yield in next Tuesday’s July 2016 WASDE report. That said since 2000 the USDA has only adjusted the U.S. corn yield 3 times in the July report, and of those 3 instances, only one represented an increase (July 2003). Therefore even in 2014 the USDA waited until August to make its first yield increase, which was in retrospect a fairly conservative 2.1 bpa uptick (167.4 bpa). Time to dig into the numbers to see if we can get a better reflection of the 2016 corn crop.
IS The U.S. 2016 CORN CROP AS GOOD AS 2014?
I looked into this question even more aggressively this week and I’m still drawing the same conclusion, which is the 2016 U.S. corn crop is not equivalent to 2014 for the following reasons:
As of the USDA’s last official weekly Corn Condition summary on October 27th, 2014 Illinois’s corn crop was rated 83% good-to-excellent with a remarkable 35% of that figure considered “excellent.” The net result for Illinois that fall was a record state corn yield of 200 bushels per acre, 20 bpa ABOVE the previous record established in 2004/05. Fast forward to present, Illinois’s corn crop is currently rated 72% good-to-excellent; however of that total only 18% is considered excellent. Given Illinois’s standing as the 2nd largest state corn producer (accounting for 13.2% of the total U.S. harvested corn acreage base), for the U.S. to achieve nationally a yield averaging over 170 to 171 bpa it has thus far required a record corn yield from Illinois. And based on what we know today I wouldn’t put IL’s 2016 corn crop within 15 bpa of its record yield from 2014/15. In fact I have IL’s corn yield closer to 178 to 180 bpa at this time, which puts it on par with 2013 (178 bpa), 2008 (179 bpa), and 2004 (180 bpa). Again this would still represent a good or slightly above trend-line yield result for IL in 2016; however it would still fall well short of the new high-water mark established in 2014.
- Other key corn growing states such as Indiana (5th largest harvested acreage base in the U.S.) and Missouri (8th largest harvested acreage base in the U.S.) also had incredible growing seasons in 2014. Indiana’s corn crop ended 2014 rated 78% good-to-excellent with 26% of that figure considered excellent, which resulted in a final record corn yield of 188 bpa (+11 bpa ABOVE its previous record from 2013/14). Conversely Indiana’s 2016 corn crop is currently rated 73% good-to-excellent with just 16% of it rated excellent. Based on recent history this type of corn ratings has been more indicative of a state yield closer to 170 to 174 bpa. Even in 2013, although the final corn ratings in Indiana were similar to 2016 at 74% good-to-excellent, 28% of IN’s crop was rated excellent that year. Point being for Indiana to realize a final yield approaching 180 bpa, it required more than a quarter of the state’s production to be in excellent condition. Right now that isn’t the case.
In Missouri the 2016 corn crop isn’t even remotely close to what the state produced in 2014. 2014’s corn crop ended the growing season rated 87% corn good-to-excellent ratings with 46% considered excellent. This culminated in a record yield of 186 bpa (+24 bpa ABOVE its previous record yield from 2004/05).
Missouri’s 2016 corn crop is currently rated just 67% good-to-excellent with just 14% rated excellent. This is better than last year’s rating for MO of 51% as of 7/5/15, which eventually led to a final state yield of 142 bpa; however I’m not sure many analysts are considering a final yield above 160 bpa barring a near perfect weather scenario for the remainder of July and August.
The antagonists will suggest that I’m looking past the stronger 2016 crop ratings for Iowa (+2% versus 2014), Minnesota (+11% versus 2014), and Nebraska (+5% versus 2014); however in my opinion of those 3 states only Minnesota’s rating clearly suggests a material state yield increase relative to 2014 is warranted at this time. And although Minnesota’s harvested corn acreage base is certainly a force at 8 million acres, it isn’t Iowa at 13.6 million harvested acres or even Nebraska at 9 million harvested acres. Traders need to remember that even 2015/16’s final U.S. corn yield of 168.4 bpa required record state yields from both Iowa (192 bpa) and Nebraska (185 bpa). Therefore on the two occasions the national corn yield exceeded 168 bpa; Iowa, Illinois, or Nebraska (one or more of those 3 states) achieved record state corn yields with the other(s) producing something close to trend-line. Right now I don’t see those same ingredients in play, which over time I believe still favors a final U.S. corn yield in the 165 to 168 bpa ranges. Good…but not record-breaking.
CZ6 PRICE OUTLOOK HEADING INTO NEXT WEEK:
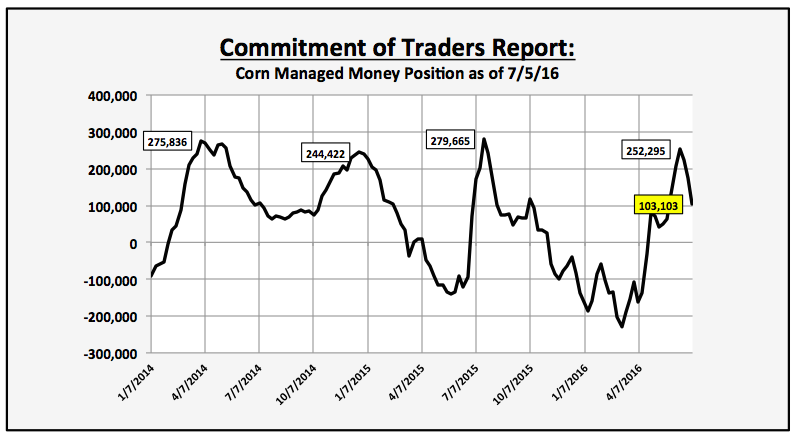
On Friday the CFTC’s Commitment of Traders report showed Money Managers shedding another 71,623 corn longs week-on-week, as of Tuesday’s market close (7/5). Therefore the Managed Money position was revised down to a remaining net long of 103,103 contracts versus its peak of 252,295 contracts on June 14th. This would suggest that a secondary wave of additional managed money selling is possible over the next several weeks if Midwest weather conditions remain ideal through corn pollination. That said I would not expect this sell cycle to be as aggressive as the initial liquidation phase that resulted in a $1.03 per bushel break in corn futures from the day high of $4.49 on 6/17 down to Wednesday’s new contract low of $3.46.
There are two other sound fundamental and technical reasons for December corn futures to resist trading sharply below $3.50 CZ6 at this time:
- Most traders would agree there is now no summer weather premium remaining in corn futures with most of the U.S. corn crop still approaching corn pollination. NOAA’s 6 to 10-Day and 8 to 14-Day weather forecasts both show above-normal temperatures returning specifically to the Eastern Corn Belt (Illinois, Indiana, and Ohio). This could over time pressure good-to-excellent ratings in several key corn producing states and quickly change the narrative regarding the U.S.’s ability to replicate the record corn yield from 2014.
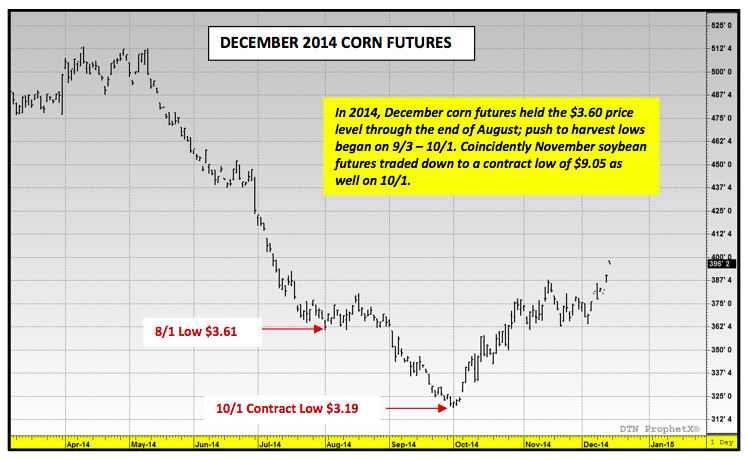
- Technically, the analog corn futures pricing comparison to 2016 is now clearly 2014. In 2014, December corn futures did NOT trade below $3.60 per bushel until September (see CZ technical charts on page 8). The harvest low in 2014 was forged from 9/3 through 10/1, with CZ breaking to a day low of $3.19 on October 1st. That low also coincided with November soybean futures trading below $9.10 per bushel. Therefore the argument could be made that December corn futures have gotten ahead of themselves with the calendar reading only July 8th, as well as, November soybeans still trading over $10.50 per bushel on Friday.
Therefore I do believe corn futures will transition to more range bound price action next week even if Tuesday’s July 2016 WASDE report shows the 2016/17 U.S. corn carryout back over 2,150 million bushels versus the June estimate of 2,008 million. The market has already been pricing in this type of ending stocks increase since the June 30th planted acreage revision (planted acreage raised 547,000 acres versus March to 94.148 million acres). I’m not bullish; however I also wouldn’t establish new shorts under $3.60 CZ6. Selling rallies back to key resistance levels will now likely be the goal for remaining Managed Money and Producer longs.
Thanks for reading.
Twitter: @MarcusLudtke
Author hedges corn futures and may have a position at the time of publication. Any opinions expressed herein are solely those of the author, and do not in any way represent the views or opinions of any other person or entity.
Data References:
- USDA United States Department of Ag
- EIA Energy Information Association
- NASS National Agricultural Statistics Service


 Rolling Over At Key Fibonacci Level?")