There was no denying the momentum for Twitter, Inc. (TWTR) heading into, and out of, its IPO offering. But as the calendar flipped to 2014, TWTR stock began to struggle. Its fall from momo grace has seen the stock drop 40 percent from its December 26, 2013 price highs. That said, the decline has brought TWTR technical support into view. Will this support simply slow the decline? Or will it produce a tradeable rally?
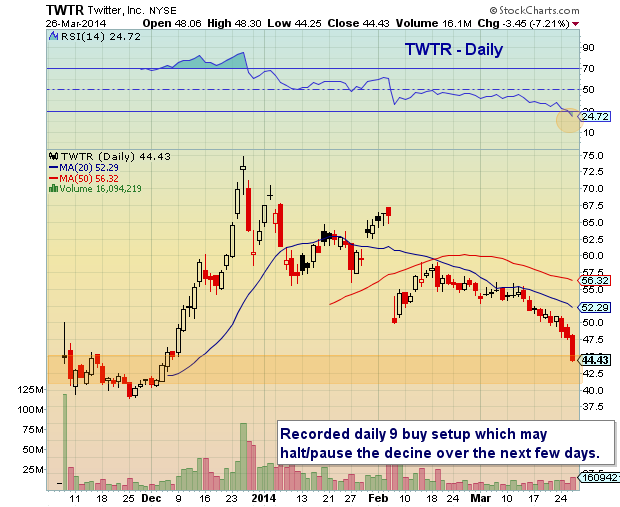
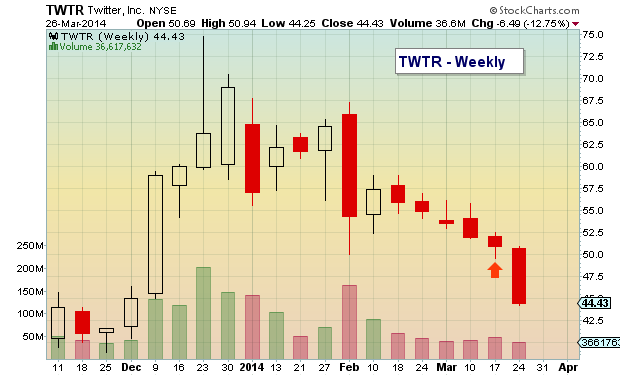
This TWTR technical support band dates back to its first few weeks post IPO (see chart below). As well, the RSI has fallen under 30 on the daily chart and registered a 9 daily buy set up (as of yesterday’s close – March 26). Note that the weekly chart registered a 9 buy setup last week as well.
So what would be the most bullish scenario? I am watching for a momentum low (as registered by RSI) followed by a brief bounce and subsequent move lower that produces an RSI divergence (new low on price, higher low on RSI). That would likely get me in for a risk-defined trade. Either way, the stock should find some support over the coming days… but what it does with that support will be telling. Patience may be the key. Trade safe.
TWTR Daily Chart
TWTR Weekly Chart
No position in any of the mentioned securities at the time of publication. Any opinions expressed herein are solely those of the author, and do not in any way represent the views or opinions of any other person or entity.


