Many of you that have read my posts and know that I don’t have a clue (or a care) for fundamentals. I strictly analyze the charts of interesting stocks / assets / indices for price patterns. Just patterns, all the time. Today, we’ll look at Twitter (NYSE:TWTR). And more specifically, we’ll look at Twitter’s stock price decline and why its stock chart may be pointing to new lows.
The process of chart pattern recognition has always fascinated me. Similar to other processes, it provides you with areas to define your risk. Just check out my archives. I covered GoPro (GPRO) extensively and highlighted why the stock could fall under $10/share. A lot of readers didn’t like that projection, but the math/patterns pointed to that level.
Okay, on to Twitter’s stock chart. As most are aware, TWTR has been on a wild ride lately. And once again, the stock gave bulls reasons to get there hopes up… before pulling the rug out.
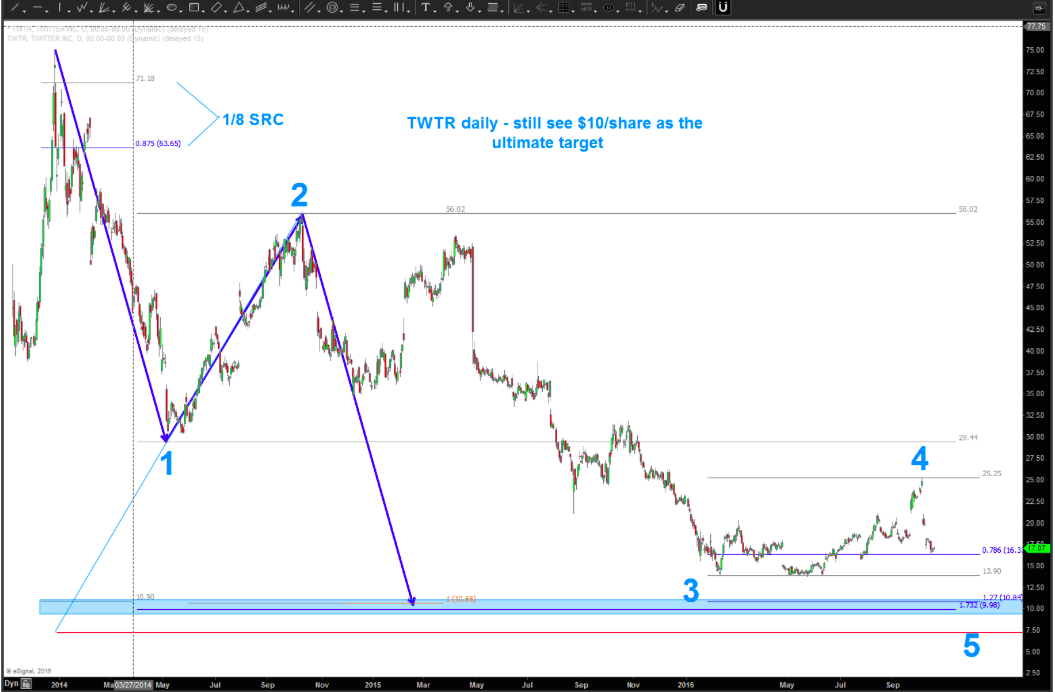
In the chart below, you can see that the $10 area has been my long term target. When TWTR got down to about $13 and took off higher, I was like “oh well, it didn’t quite hit the pattern”. No biggie… BUT the move higher hit reverse hard recently and the stock is now threatening to take out a key support level: Its .786 Fibonacci support level (hit last Friday). If that critical support level breaks to the downside then it appears ready to move towards the long term $10 target. It’s always an adventure… we’ll see.
Twitter Stock Chart (TWTR) – Pattern w/ levels to watch
Thanks for reading and happy (safe) trading out there.
Twitter: @BartsCharts
Author does not have a position in mentioned securities at the time of publication. Any opinions expressed herein are solely those of the author, and do not in any way represent the views or opinions of any other person or entity.


