Major indexes find themselves at a critical juncture. On one hand, longer-term patterns are clearly bullish, the October recovery was such a statistical outlier that it probably reflects tremendous buying support in the market, and we have a (much weaker than is usually assumed) bullish seasonal tendency for the remainder of this month. On the other hand, macro news does not appear to be constructive, and, more troubling, European and many Asian indexes appear to be on the verge of breaking down.
Bullish Signal For Stocks?
Putting all of this behind us for a moment to focus on the pure market structure, we find major US indexes consolidating near recent highs, and also a protracted period of small cap underperformance. Yesterday had a few potentially bullish factors: first, small caps were tremendously strong much of the day, and, for the first time in a long time, we saw small caps decisively leading an intraday rally. Second, this action—a strong overnight selloff (with Europe) followed by a strong New York session recovery, has left a potentially significant one day timing bullish signal.
ES E-mini S&P 500 Chart
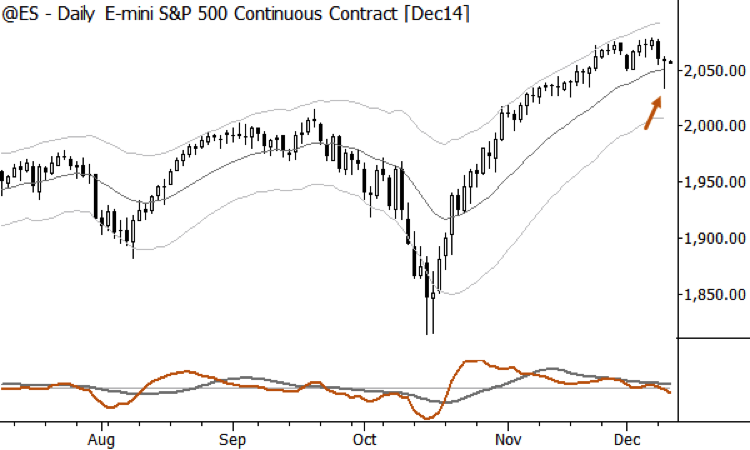
Taking a look at the chart above, you see something that some candlestick traders would dub a “hammer”, but think a bit deeper into the action hidden in that bar: many traders made mistakes. That is the key—a strong early selloff shows that weak hand longs were potentially flushed out of the market, and perhaps a little further rally will find them chasing the market, adding their buying pressure to the pressure already in this consolidating up against recent, significant highs. This can also be applied against other indexes that produced hammers, especially the small caps (i.e. Russell 2000) as they were leading yesterday (making that bottom important).
No pattern works all the time, but this is an example of a small technical pattern that could have longer term significance on the index that you are Traders buying based on this pattern can establish stops just under yesterday’s low. If the market does not rally strongly within the next few days, then this bullish signal is also likely invalid. If nothing else, this is one of those small patterns that can say, “Hey! Pay attention—something might be happening here.”
Thanks for reading.
Follow Adam on Twitter: @AdamHGrimes
No position in any of the mentioned securities at the time of publication. Any opinions expressed herein are solely those of the author, and do not in any way represent the views or opinions of any other person or entity.


