Recently the energy sector as represented by the Energy Select Sector SPDR ETF (XLE) has been showing some positive price action on both traditional and P&F (Point and Figure) charts. No doubt the recent rally in Crude Oil prices has helped.
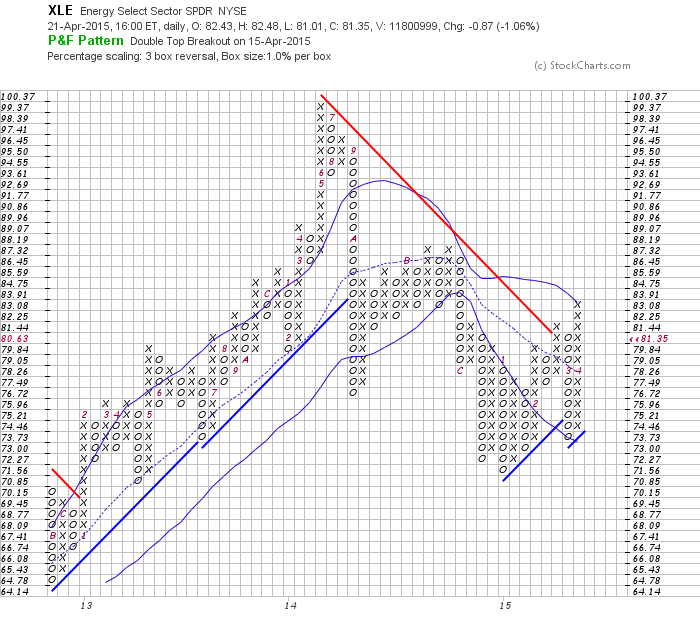
Today, I want to focus my attention on the P&F chart for XLE (see below).
There are two very quick takeaways:
1. The downtrend which started in the summer of last year has been broken.
2. More recently we have a double top buy signal.
At this point it’s too early to tell whether this is a countertrend rally within a larger downtrend or the beginning of a new longer term uptrend. That said, the price action in the energy sector is constructive and the near term trend is up at this time. Crude Oil prices will likely continue to be a major factor going forward.
Energy Select Sector ETF (XLE) – Point & Figure Chart
Follow Karl on Twitter: @Snyder_Karl
No position in any of the mentioned securities at the time of publication. Any opinions expressed herein are solely those of the author, and do not in any way represent the views or opinions of any other person or entity.


")


")