The 10 year treasury yield, USDJPY and S&P 500 are all close to lining up with DeMark buy setups on daily charts. The S&P 500 will form a completed TD BUY setup by next Tuesday. This should provide a low to this equity move which drives prices back up to highs into July. The timing seems to align, as a treasury yields bottom seems near as well.
Most sectors are well off today’s morning lows. We are still seeing strength in Utilities, Telecom, and Staples, while Energy, Industrials and Financials are treading water. But Financials curbing losses and reversing is something to watch.
The Volatility Index (VIX) stretched outside its upper Bollinger band, while VIX futures contango showed Spot VIX well over next couple months. I would expect the next couple trading days to show a very elevated TRIN reading coinciding with lows. This is something to monitor. Overall, one may be able to sell into this afternoon’s gains, and use any further pullback to lows into tomorrow or early next week to cover shorts. As I said above, technically, we seem close to being “there”.
Note this was written intraday during trading today.
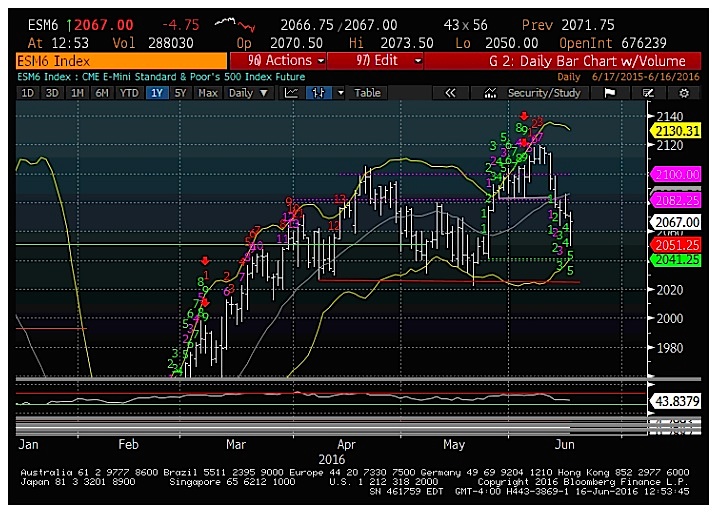
S&P 500 Futures (June)
Equities have pulled back to just above support, and can’t rule out another 2-3 days of weakness. However, the risk/reward for shorts technically should be growing poor by tomorrow, as the S&P 500 gets down towards the lower edge of the Bollinger. If my thinking is right, a treasury yields bottom (and subsequent bounce) should help Financials also find a bottom. This, in turn, will help the market rally up off the lows and should be a good thing for both Equities and USDJPY next week. See the daily chart of JUNE S&P 500 futures below.
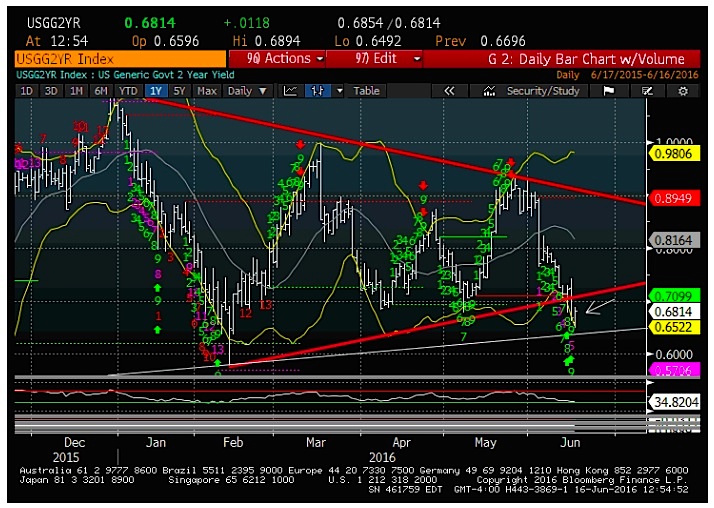
2 Year Treasury Yields
2 year treasury yields have also gotten down to key support. The green 9 on the daily chart below shows a TD BUY SETUP. Note this was successful at picking lows in early May on the 2 year treasury yield chart, as well as in February. This is offering clues that the Bond rally has happened a bit too quickly. And, in this case, the 2, 5, 10, and 30 yr yields should be nearing support to turn yields back HIGHER. Regardless of economic news, yields have just gotten too stretched.
Thanks for reading.
Twitter: @MarkNewtonCMT
The author may have a position in mentioned securities at the time of publication. Any opinions expressed herein are solely those of the author, and do not in any way represent the views or opinions of any other person or entity.
")


 Rolling Over At Key Fibonacci Level?")