I haven’t been trading too actively lately as my schedule has become busy, but yesterday I had some time to focus on the market and decided to place some trades that I thought offered decent risk/reward opportunities.
Here’s a review of 4 trades I made on November 16:
Trade 1: S&P 500 ETF – $SPY
The S&P 500 ETF ($SPY) closed down Friday for the third consecutive down day and was $9 from the highs earlier this month. Following the tragic events over in France that day, $SPY drifted down in after-hours trading hitting a low of $200.76. Coming into the day, I had more of a bullish bias given the post-market flush that had already occurred.
As you can see from my tweets and the charts below, I got long a “feeler” and looked to add above $204, as that would be price confirmation of a reversal. The trade worked out better than I thought, as $SPY closed at the highs of the day at $205.61. I trimmed a good chuck of my position by the close but am still long some. Going forward, I think $207-$207.50 is a reasonable target for this type of trade.
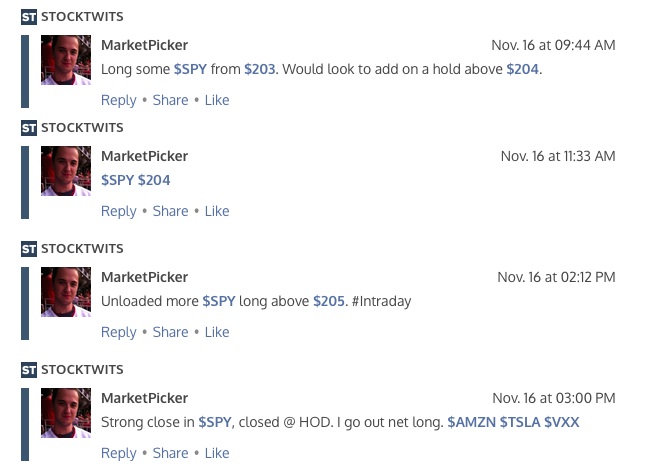
$SPY Intraday
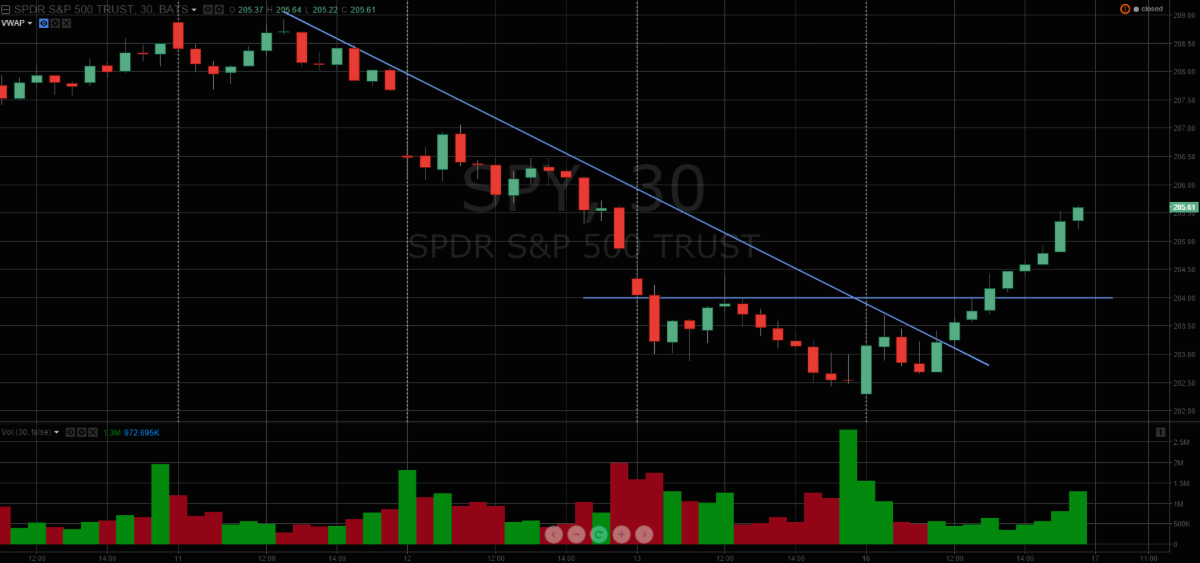
$SPY Close
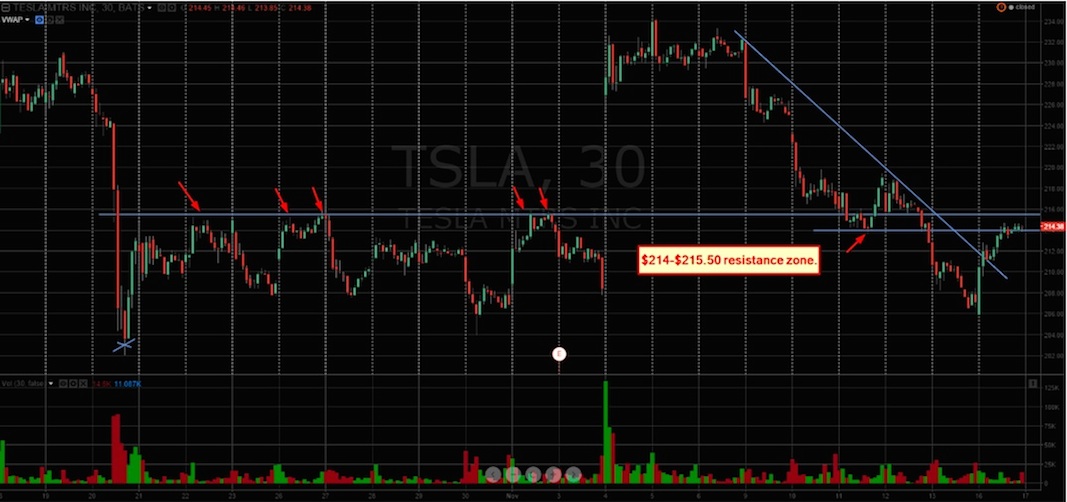
Trade 2: Tesla – $TSLA
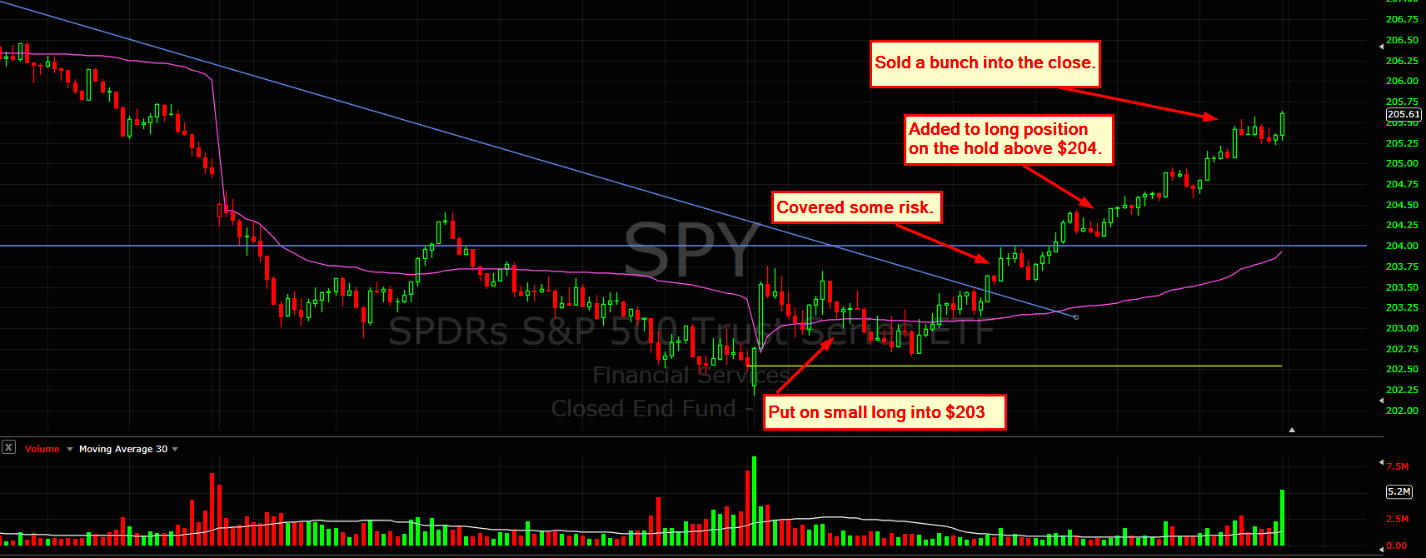
Tesla ($TSLA) had a strong opening drive, and I had an upside alert go off above $211, which was a level that acted as intraday resistance Friday. After seeing the stock consolidate above that $211 level, I decided to get long. As you can see from my tweets, $214-$215.50 was the spot I was watching for price confirmation to add to my trading position. $TSLA closed within this resistance zone today. Going forward, I’d like to see a hold above today’s highs and a thrust above $215.50. Above that, I’d look at $218-$220 as potential resistance.
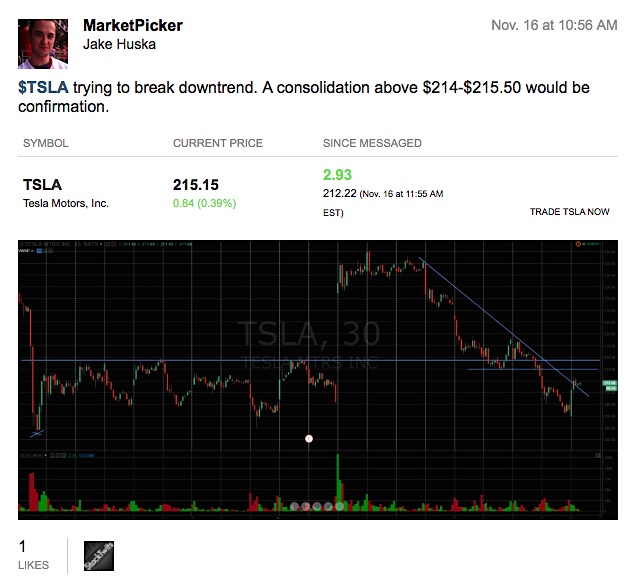
$TSLA (30 MIN) – Updated
Trade 3: Amazon – $AMZN
After its huge run up above $675, Amazon ($AMZN) closed down on Friday for the second day in a row. As you can see in my first tweet below, the stock was pulling into its uptrend line and support area around $620-$624. If the market was going to reverse upwards, I thought this had a high probability of reversing as well given it was pulling back to technical support, from a trading perspective.
continue reading on the next page…


