Despite another sideways and choppy day for the stock market indices, signs of strength persist. Dip buyers again stepped in to defend the 2100 support level on the S&P 500 and drove it back to close relatively unchanged. Additionally, most stock sectors (with the exception of the Utilities) finished the day mildly higher. All in all, not a bad day of trading action.
Given the above, being bearish or aggressively short is a risky proposition at this time in my opinion.
That said, let’s dig a little deeper into the trading action…
Here are 5 stocks that have intriguing chart setups heading into tomorrow.
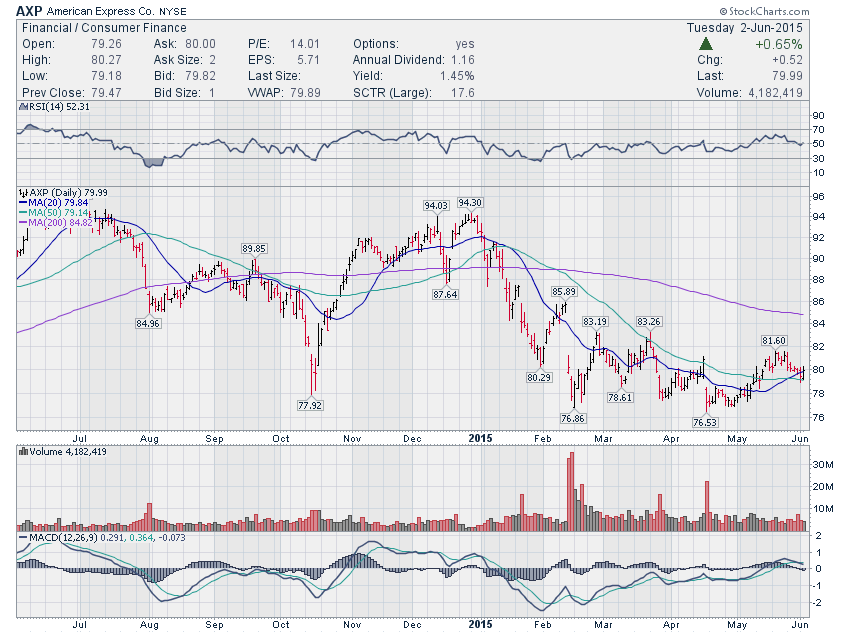
1. American Express Company (AXP) – There is a constructive four-month bottoming/basing pattern with a double bottom. This has been followed up by a technical breakout (in May) and a pullback to support in the 79-80 area. I am expecting continuation through 80.30-80.40.
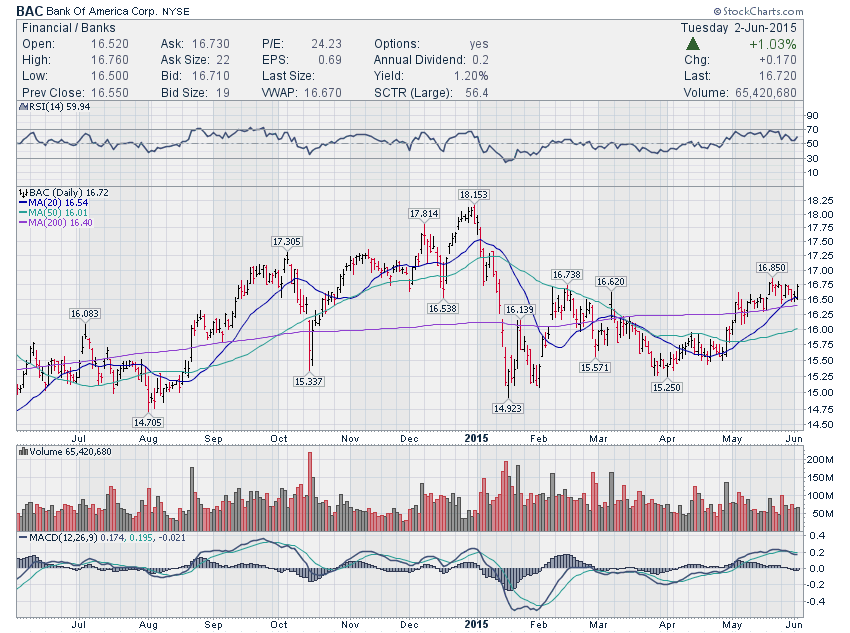
2. Bank Of America (BAC) – Traders saw a bullish bounce off the 200 day moving average. It seems like BAC is getting ready for a continuation move toward 17. This looks like a good stock to keep on your trading radar.
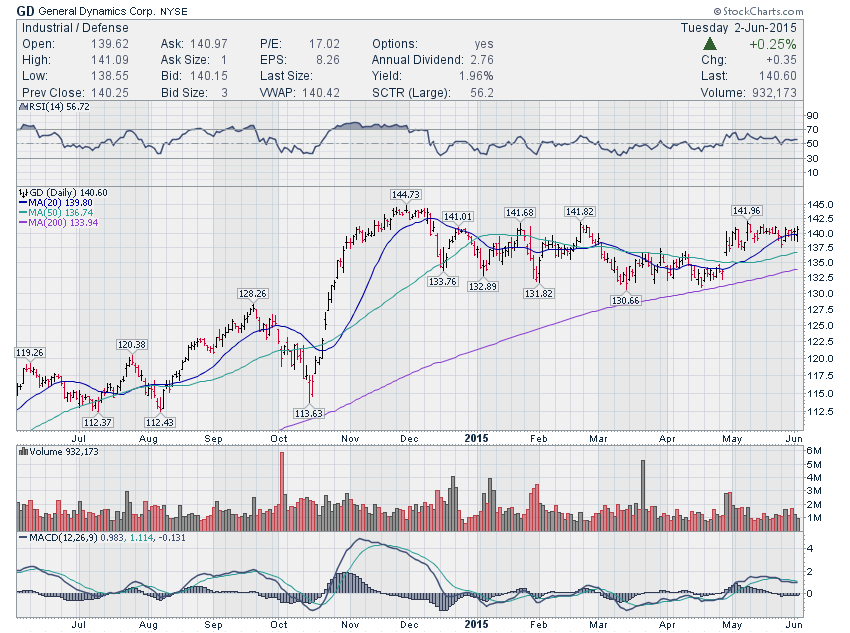
3. General Dynamics Corporation (GD) – This stock is continuing to consolidate in a narrow range around the 20 day moving average and 140. Attempts by the bears to break this range have been rejected, resulting in a bullish reversal. It now needs to see continuation through 141.20-141.30.
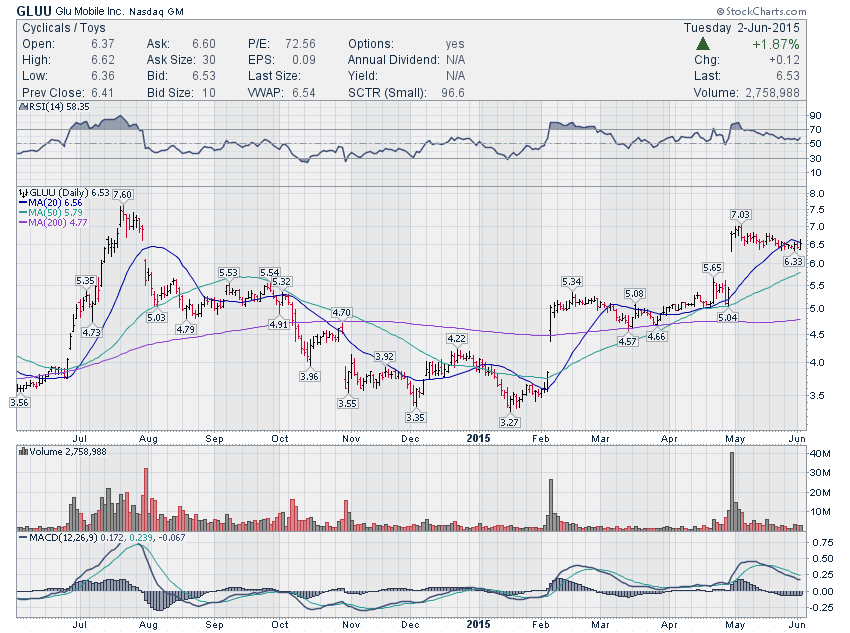
4. Glu Mobile Inc (GLUU) – The stock spent the entire month of May in a sideways consolidation following it’s massive breakout in late April. Today’s bounce off 6.30 and through the 20 day moving average could lead to a bigger move toward 7 and beyond.
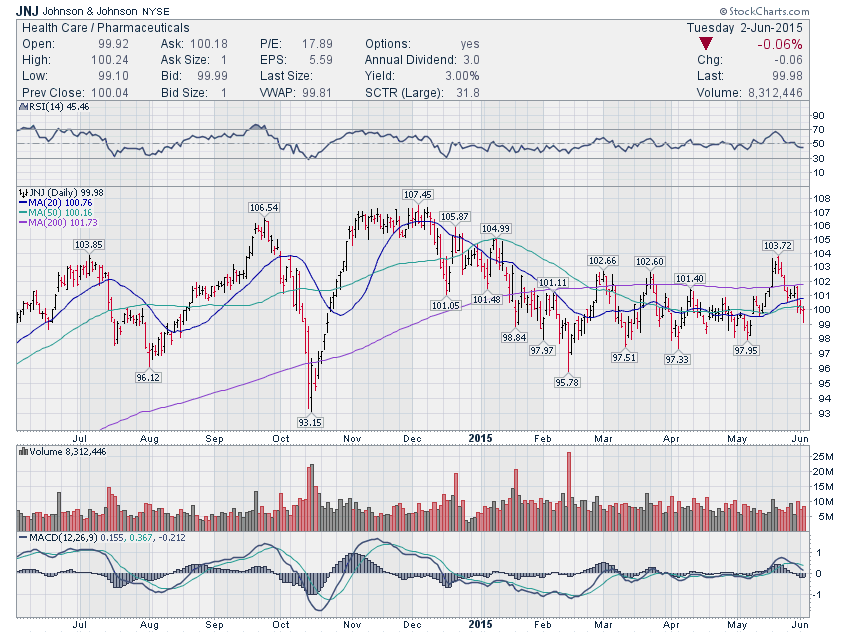
5. Johnson & Johnson (JNJ) – There was a somewhat sloppy, yet sharp, two week pullback. But it resulted in a bounce off support around 99 which could lead to a short-term trend reversal and move higher toward 102-103.
Thanks for reading.
Twitter: @NoanetTrader
No position in any of the mentioned securities at the time of publication. Any opinions expressed herein are solely those of the author, and do not in any way represent the views or opinions of any other person or entity.


")


")
