The stock market is still trying to decide its next move which puts pressure on the mental aspect of trading and finding sound trading ideas.
At this point, we have to be careful not to force trades, but at the same time we need to trust our process. This usually leads to patience, which is okay.
Below I have put together 4 trading ideas that I have on my watch list. These four stocks have trading setups that look interesting and may bear fruit for disciplined traders.
4 STOCKS TO WATCH
Alibaba Group Holding (BABA)
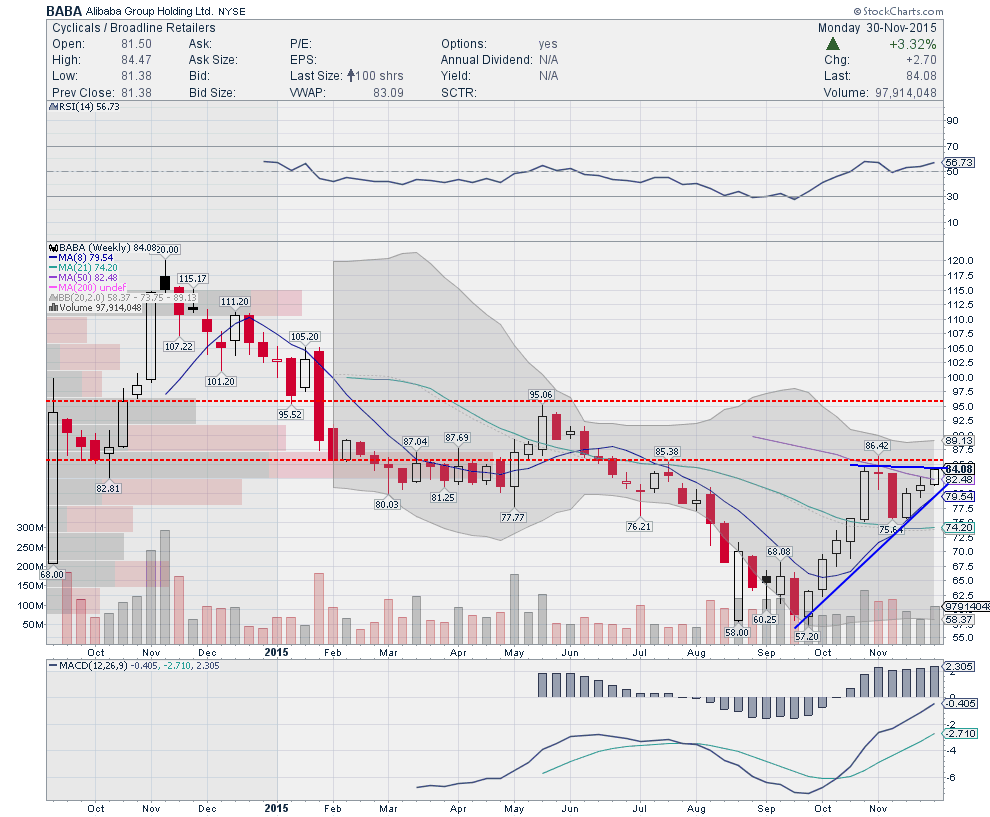
Alibaba stock (BABA) has formed a nice round cup after bottoming out in late October and now formed a rounded handle to add to it. BABA moved higher on heavy volume yesterday after the news that it was getting added to China’s MSCI Index.
I think the move is just getting started with initial resistance around 85.7 where we may see consolidation. The momentum indicators for BABA are bullish with RSI nicely over 60 and MACD just getting ready to make a bullish cross. Bollinger bands are slowly opening up on this timeframe. On the weekly chart for Alibaba, there is a bull flag formation and the measured move is towards 95.06. Alibaba stock looks spring loaded right here, however traders could wait for consolidation between 83-85.7 area before entry. The company reports earnings on January 28th, 2016 after market close.
Alibaba (BABA) Stock Chart – daily

Alibaba (BABA) Stock Chart – weekly
eBay Inc. (EBAY):
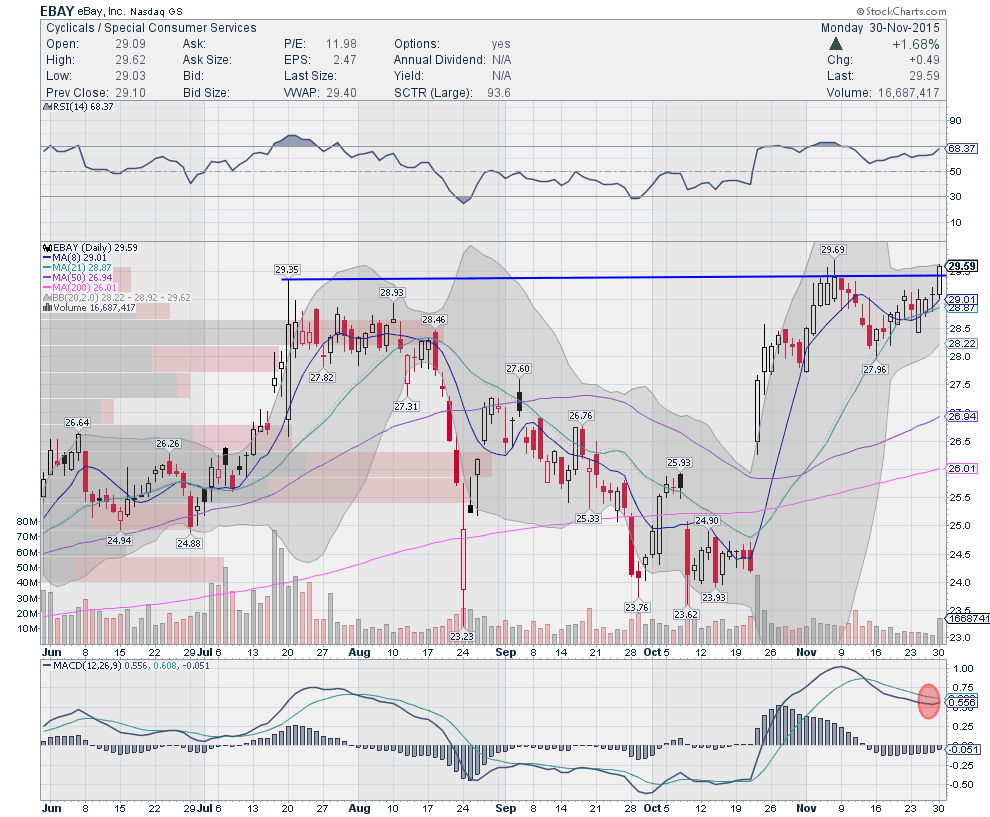
EBAY stock price sold off heavily from the spinoff but bottomed out in late October. There were new positions opened by George Soros and Carl Icahn and the stock has gapped higher and is now trying to breakout. Today (11/30), EBAY tried to break over the 29.55 level and finished at 29.59.
A continuation pattern over 29.69 should lead to 31.00-31.42 at the very least. MACD is turning up to make a possible bullish cross while RSI is rising in the bull range. A break above 29.69 takes EBAY stock towards 31. On the weekly chart (not shown), price is slightly extended from the 8 week moving average but overall the stock looks very healthy. EBAY is expected to report earnings on January 20th, 2016 and hence there is plenty of time from now until then for the stock to move higher.
eBay Stock Chart – daily
read more on the next page…


