At its core, the stock market is little more than a competition. It is about winners and losers.
For companies, it is about gaining an edge on the competition and in so doing providing its stock holders with a favorable return on investment, often over years and even decades. Companies that do not deliver the expected results will fail to attract investors and their stock will suffer. Some widows and orphans retire with their winnings; the losers are not so fortunate.
We see the competitiveness play out with analysts each quarter and year end as the financial headlines highlight the big winners and losers. If you bought stock X your 10K investment would now be worth X amount. But if you bought stock Z your 10K investment would need an infusion of 20% just to get back to even. But this quarter’s big winners can often be the next quarter’s big losers. First place is temporary. Analysts also vie to correctly predict the next big winners based on their own sub-conscious biases hidden behind power point presentations of complex fundamental formulas. It’s just another competition to see whose prediction is proven correct, thus earning the analyst prestige and air time, not to mention bigger bonuses.
For stock traders, whose decision making processes are formulated using various forms of technical analysis, the competition plays out each day in the charts. Looking for, and taking advantage of, any shift in supply/demand is at the heart of technical analysis, whether it be in the form of a bullish trend where demand drives prices higher or a bearish trend where supply is readily available but at lower prices. The direction of the trend declares the winner, at least for the time being. Bulls win money. Bears will money. Pigs do not participate.
When there is no clearly defined winner or when a past winner has cashed in his earnings, the contestants battle it out between supply and demand levels known as support and resistance. We will see this battle described in various ways. Some will refer to it as a consolidation or congestion phase; others as an accumulation/distribution zone. There are also variations of these trading battle zones often referred to as flags, pennants, and triangles, among others. On the charts we can draw boxes or rectangles to enclose the price as a clearly defined visual representation of the battle between supply and demand. The winner is usually declared when there is a break from the box to continue the previous winner’s trend or reverse it for a new winner. How long it lasts it quite another matter.
In their classic text on technical analysis, Robert Edwards and John McGee provide a vivid description of the rectangle and its meaning in trading:
The Rectangle might, with even greater propriety, be called a picture of conflict. Of course, any fairly compact price formation represents conflict in the supply–demand sense. A Head-and-Shoulders Top, for example, portrays a conflict between “strong” sellers and “weak” buyers, with the outcome already clearly to be seen before the combat has ended. But a Rectangle defines a contest between two groups of approximately equal strength —between owners of the stock who wish to dispose of their shares at a certain price and others who wish to accumulate the stock at a certain lower figure. They bat the ball back and forth (up and down, that is) between them until ultimately, and usually quite suddenly, one team is exhausted (or changes its mind) and the other then proceeds to knock the ball out of the lot. Nobody (often, not even the contestants themselves) can tell who is going to win until one line or the other is decisively broken. – (Technical Analysis of Stock Trends, 6th edition, p. 142)
Lest we forget, charts merely provide information. It is up to each trader to interpret them, as technical analysis is simply an experiment in subjectivity. Each trader must decide where to define a box and the trend that may be associated with it, along with the time frames (or frames) employed. Boxes can come in all shapes and sizes depending on the length and breath of the battle taking place, so there can be no right or wrong way to define it, as exact science has little relevance when opinions based on biases are involved, such as we find in the markets. It’s simply about a process (read more about the process on my site).
Entry and exit criteria are also subjective with the simplest entry at the pre-determined box break and the initial stop loss at or just below the break. Measured moves are often used if the box break continues in the direction of the previous trend while trailing stops can be used if the trader does not wish to place limits on just how far the winner is willing to run.
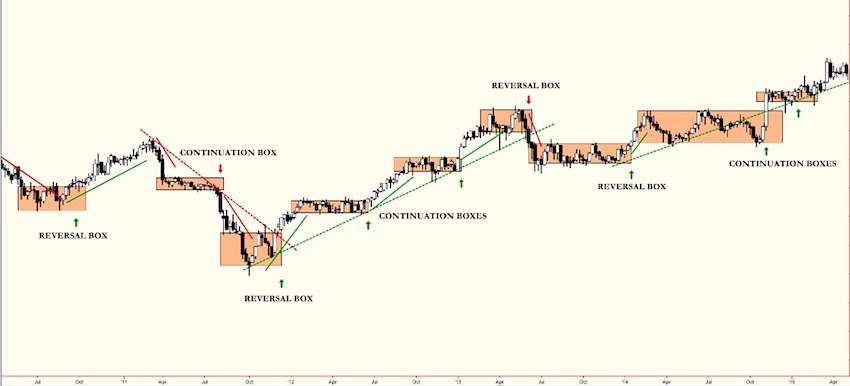
BOXES COME IN ALL SHAPES AND SIZES ALONG TRENDS AND TREND REVERSALS
Everyone wants to be on the winning team. Trading box breaks can provide you with that opportunity. Just do not expect to win every time.
Follow David on Twitter: @crosshairtrader
Any opinions expressed herein are solely those of the author, and do not in any way represent the views or opinions of any other person or entity.


