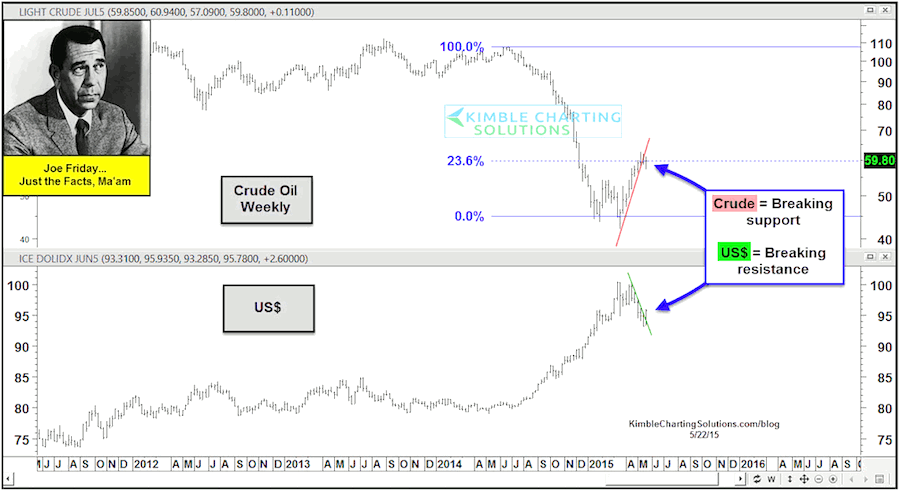
It’s been a heck of a week for The US Dollar Index. After closing last week at new three month lows around 93 and change, the US Dollar Index jumped this week to over 96. And this action is likely a big part of what’s weighing on Crude Oil prices this week.
Here’s a chart of the Crude Oil and the US Dollar Index. You can see the effect they have on each other. And both appear to be breaking their short-term trends. It’s too early to tell how meaningful these “turns” may be, but investors will definitely want to monitor the price action over the coming week or two to see if this is temporary or lasting.
It’s also worth noting that Crude Oil hit its 23 percent Fibonacci retracement resistance level (based upon last summers weekly closing highs and the 3/13/15 weekly closing low).
As mentioned earlier this week, Crude oil just experienced its 7th largest 2-month rally in its history. This one was probably ready for a breather. Enjoy the long holiday weekend and thanks for reading.
Twitter: @KimbleCharting
Author does not have a position in any mentioned securities at the time of publication. Any opinions expressed herein are solely those of the author, and do not in any way represent the views or opinions of any other person or entity.


