The market is still digesting the moves from last week, along with the FOMC statement. But Friday’s move lower also afforded an opportunity to look for stocks showing relative strength. Not all of this week’s trading ideas have that setup, but it’s a good one to look for.
Below are 7 stocks that are on my trading radar for this week. Each of my ideas are accompanied by a stock chart and some technical analysis.
1. EPAM SYSTEMS (EPAM):
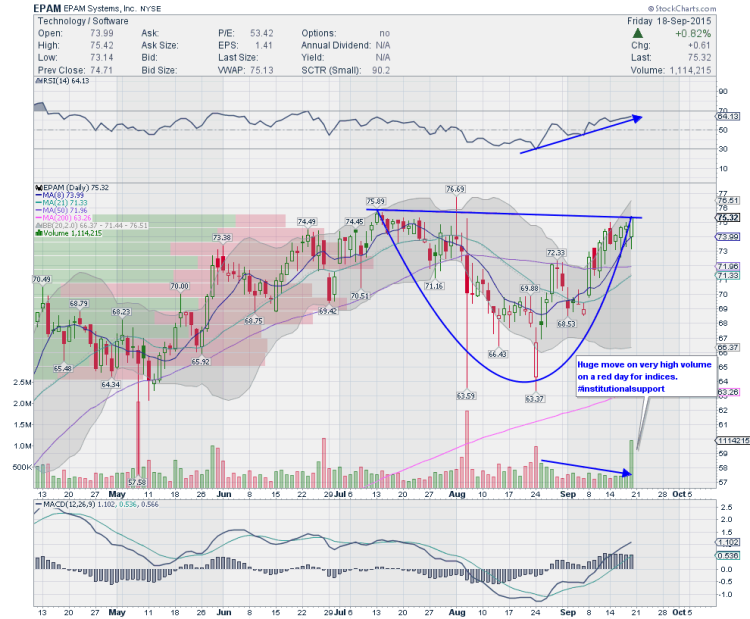
This stock has been consolidating on low volume and has formed a cup. Whether it forms a handle from here or runs without it is unknown but the stock displayed extreme relative strength on high volume on Friday when pretty much the entire market was making lows of the day. Momentum indicators are bullish and Bollinger bands have opened up which supports a potential move higher.
I am looking for a breakout above Friday’s highs. Note that this is one of the top companies / stocks listed in the IBD 50.
2. AMAZON.COM, INC. (AMZN):
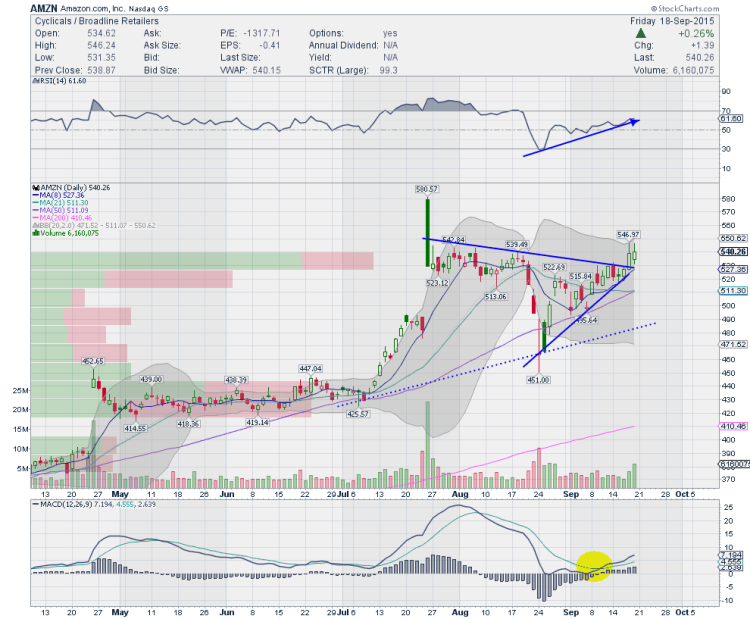
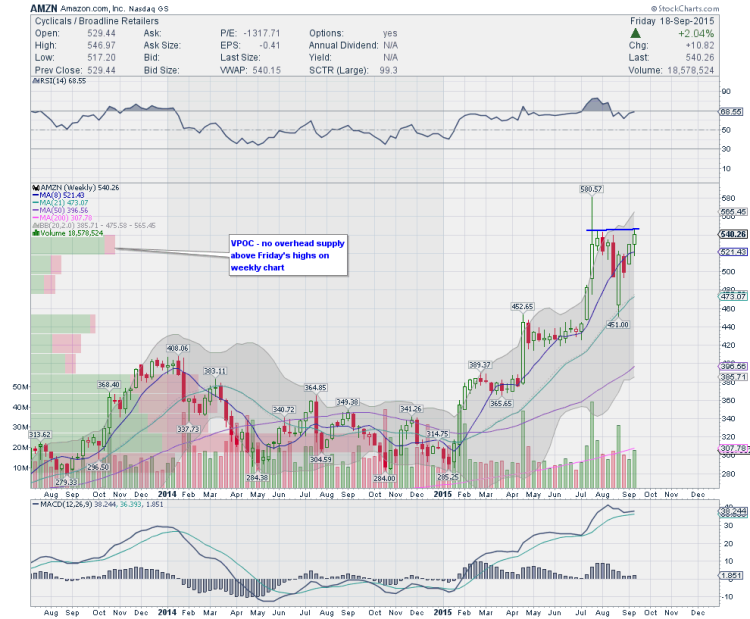
Amazon is one of the very few momentum stocks that displayed relative strength right through this choppy consolidation period including Friday. AMZN broke above the tight symmetrical triangle and a few days of basing here will certainly make room for a flag to form above this breakout level and move higher. The momentum indicators are very bullish and Bollinger bands are opening up to support this move. On the weekly chart, the chart for AMZN is flagging and there is not much overhead supply for the breakout. A retest of the earnings highs are likely in cards in due course. Keep Amazon on your radar.
AMZN Daily Chart
AMZN Weekly Chart
3. LANNET (LCI):
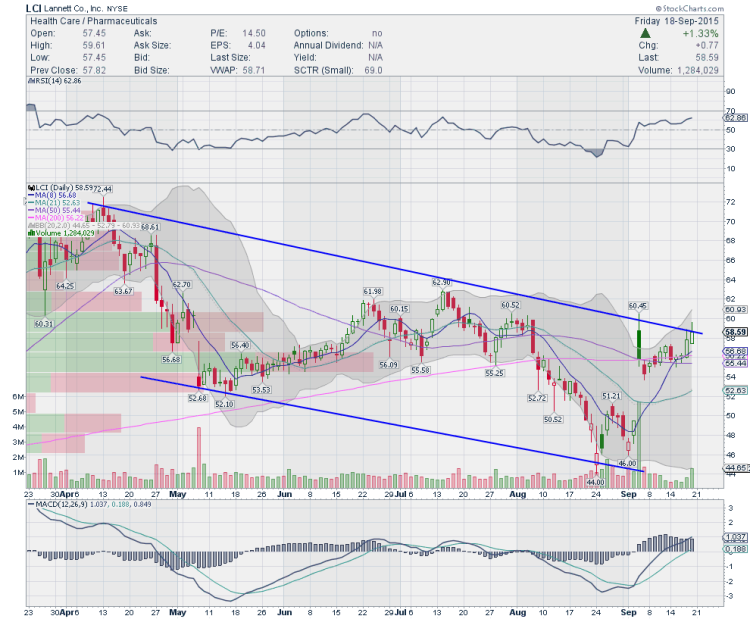
Lannet is a company that has a lot of new products and services in their pipeline. The stock has been outperforming and has formed a beautiful descending channel. A move over 60.46 should bode well for LCI to test 68 levels in due course. Bollinger bands have opened up and momentum indicators are also bullish. Also, if you notice closely, there is an upper level flag formed above the gap. A stock that has good potential for higher prices.
continue reading on next page for more trading setups…


