 By Maria Rinehart They say those who don’t learn from the past are doomed to repeat it, but I say those who do learn from the past can profit from its repetition. At the late stage of a market uptrend, we can look for vehicles that portray characteristics of past winners because what goes up eventually must come down, as did Netflix Inc. (NFLX) and Cree Inc. (CREE) in seasons past. Understanding topping patterns will assist you with risk management and help you capitalize on opportunities.
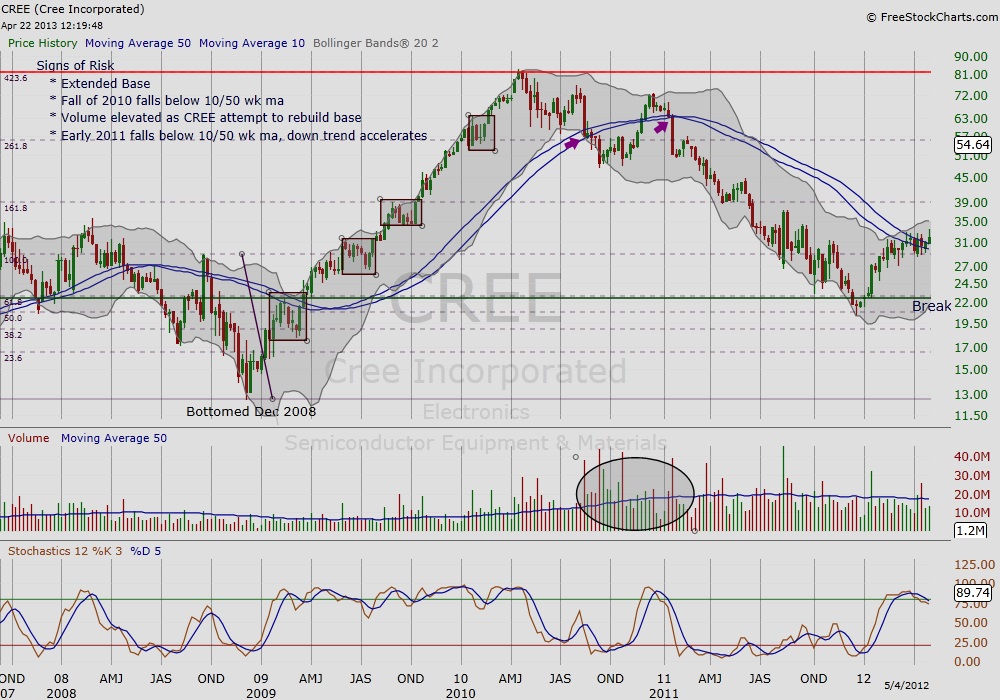
In this most recent bull market run, which began in 2009, semiconductors were early winners. After nearly a decade of listlessness, NASDAQ and technology showed signs of life. One favorite was CREE (below), which bottomed in late 2008. Its stock price then grew 700% before losing momentum in the Spring of 2010, around the same time China and many other high flying ADR’s peaked. CREE broke out of four weekly bases before tiring in the spring of 2010. However, just like Paul Newman’s character in Cool Hand Luke, past winners will fight to the end. Notice the elevated volume as CREE attempts to regain its 10/50 weekly ma in the months following the breakdown below the important 10/50 weekly ma. By late 2011, CREE would be back at its 2009 base breakout level. Watching for a break below the 10/50 followed by a failed backtest is one of many common topping patterns.
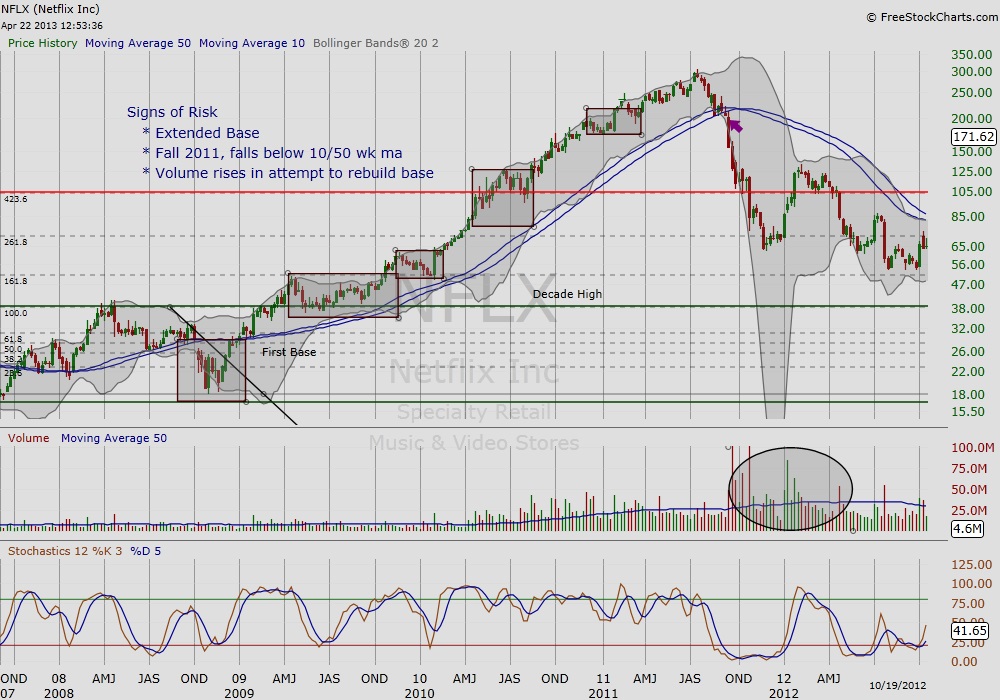
Netflix, Inc. (NFLX) was the financial media darling of the 2009 uptrend because it revolutionized the movie rental business from the clunky video store model of the past. Like CREE, it found its footing in late 2008 and broke out of a decade high by the spring of 2009. NFLX also demonstrated similar characteristics while breaking down after its great run: we see at least four solid breakouts from weekly bases. In the fall of 2011, NFLX broke below its 10/50 weekly ma. As with CREE, NFLX would not go down without a fight, and once again we saw elevated volume as it attempted to regain the 10/50 weekly ma. Again, you see the theme within these topping patterns; the break below the 10/50 followed by the opportunity (a failed backtest).
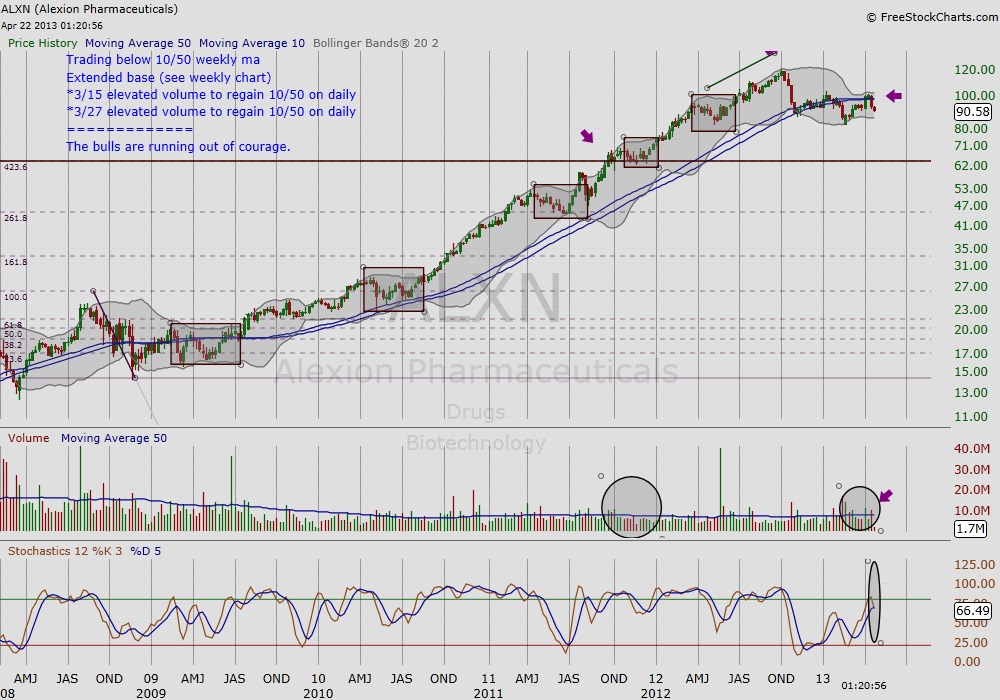
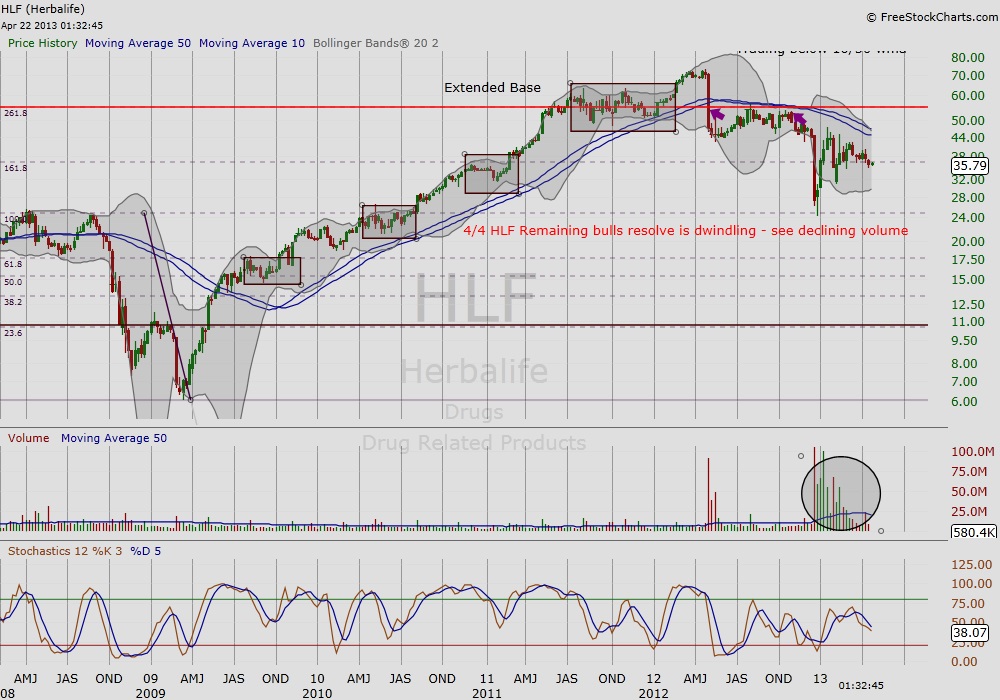
The next two charts are of Alexion Pharmaceuticals (ALXN) and Herbalife Ltd (HLF) today. Over the last few years, ALXN has shown a trajectory similar to the great winners above. The medical group in general has performed well, with names like Celgene Corp. (CELG) and Gilead Sciences Inc (GILD) among the favorites. While both CELG and GILD are not yet showing clear signs of slowing down, ALXN chart (below) shows the classic warning signals that both NFLX and CREE displayed before their great fall: we see a breakout from multiple bases and, like CREE, multiple breakdowns below the 10/50 weekly ma. However, what we do not see is the heavy volume to recoup the 10/50 weekly ma that we see with the next chart, Herbalife Ltd (HLF). Note the multiple breakouts from bases and the initial breakdown below the 10/50 weekly ma for HLF by May 2012. Of course, how can anyone forget the media storm surrounding HFL this year? According to the chart, the media spectacle was just that—a spectacle. Regardless of the news, we see the classic signs of a breakdown: multiple bases and rising volume as it tries to recoup the 10/50 weekly ma. Rising volume, as shown with both NFLX and CREE, is simply a sign of desperation and not true base building. Below are potential topping patterns for ALXN and HLF.
ALXN
HLF
Identifying topping patterns and learning from past setups is an important part of trading. Feel free to share your thoughts and comments below. Thanks for reading.
References: Charts from FreeStockCharts.com
Twitter: @RinehartMaria and @seeitmarket
No position in any of the mentioned securities at the time of publication.
Any opinions expressed herein are solely those of the author, and do not in any way represent the views or opinions of any other person or entity.


