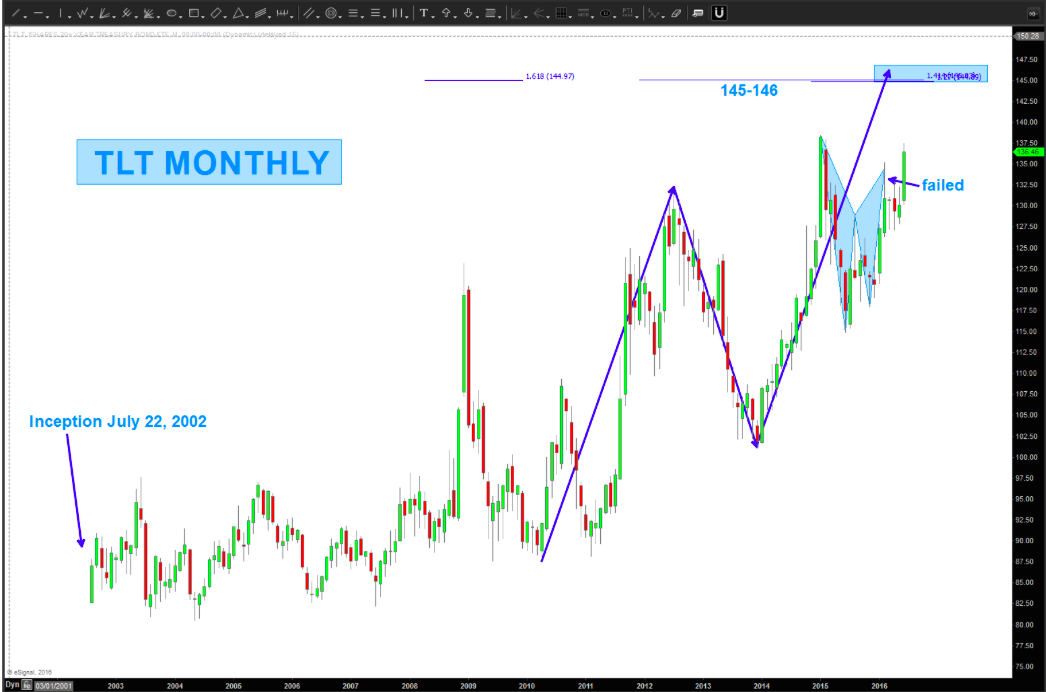
Sometimes the chart pattern works and sometimes it doesn’t. And when the chart pattern doesn’t work, it means the move/trend may be too strong and we need to re-do the math and harmonics. One such pattern that didn’t work was on the 20+ year treasury bonds ETF – $TLT.
That pattern failed today as the TLT rally proved too strong. See the failed pattern in the chart below.
This simply means that bonds (and the TLT rally) may not be done yet. Interesting… especially as we head into the BREXIT vote and deeper into the US elections with uncertainty in the air. BUT, remember that this is a monthly chart… so it doesn’t necessarily mean that the move is imminent.
So, how much higher could the TLT rally go?
Technically, it means that 145-146 isn’t out of the question for the TLT. A continuation of the rally in bonds would likely coincide with some additional downside in equities (or sideways chop). But, who knows.
Trade safe and thanks for reading.
More from Bart: Is Home Depot Stock ($HD) Topping?
Twitter: @BartsCharts
Author does not have a position in mentioned securities at the time of publication. Any opinions expressed herein are solely those of the author, and do not in any way represent the views or opinions of any other person or entity.


