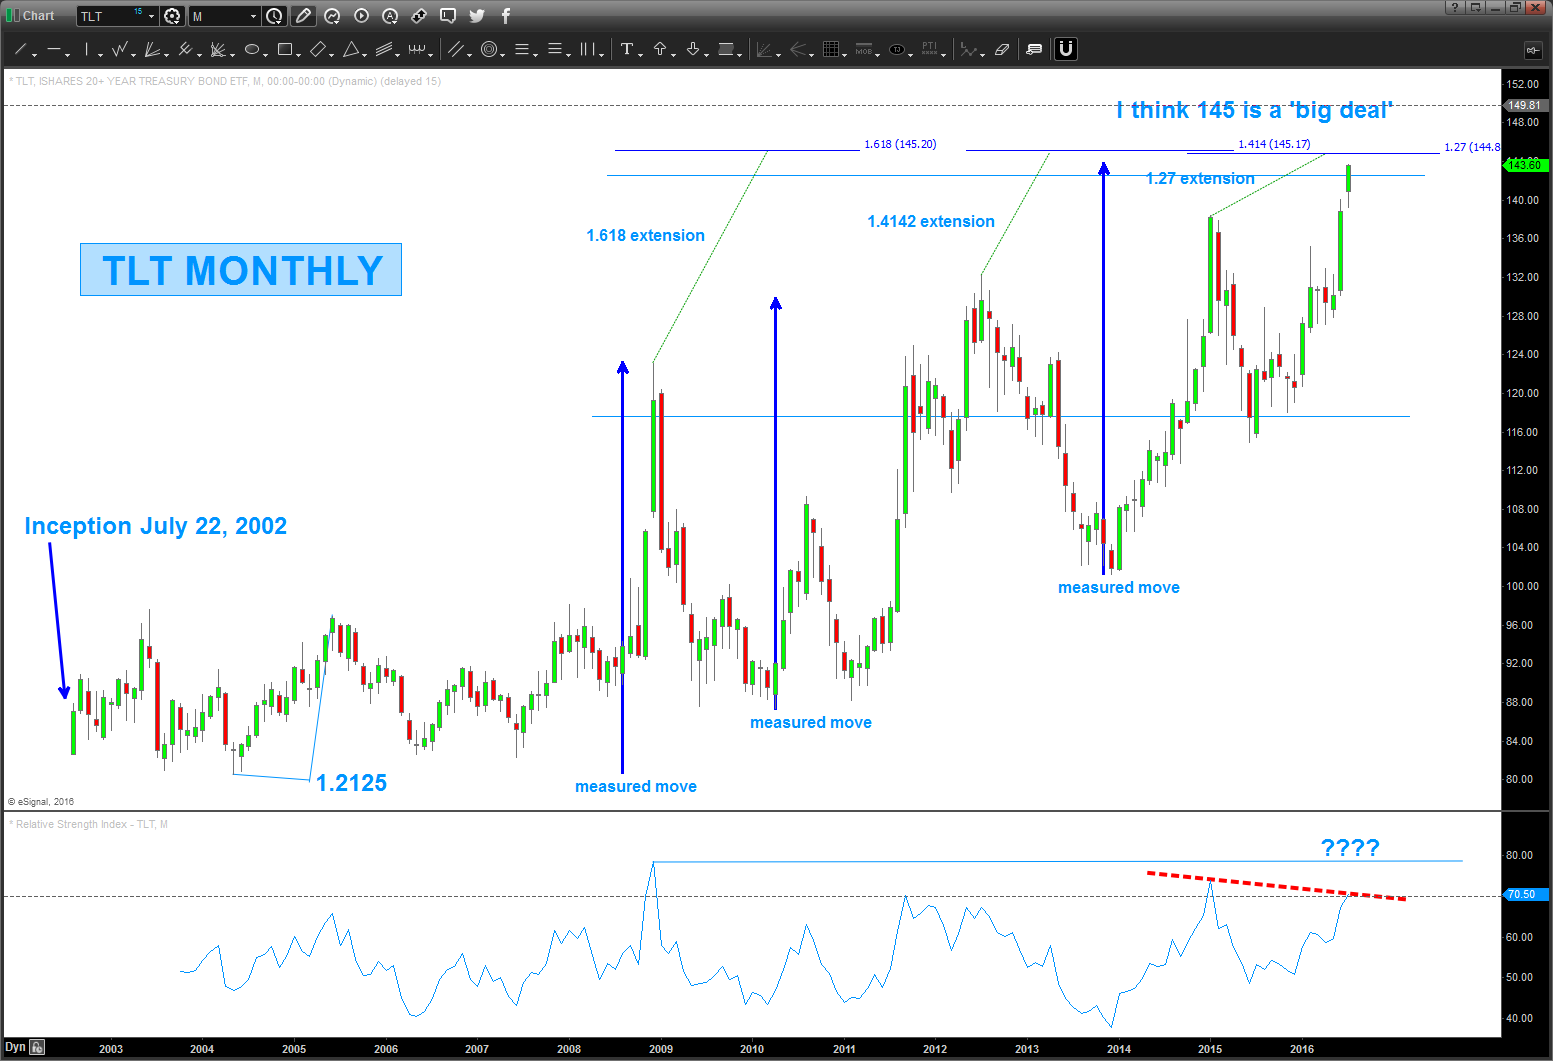
US Treasury bonds continue to move higher to the amazement of many. In my latest post on the 20 Year Treasury Bond ETF (NASDAQ:TLT), I showed how the price pattern had failed around the 134-135 level. And that failure gave way to a new chart pattern targeting 145.
Note that TLT traded over 143 today. Fixed income is getting crazy (see discussion and chart on utilities further down).
An updated chart highlighting the TLT price target is provided below.
TLT Price Target – 20 Year Treasury Bond ETF Chart
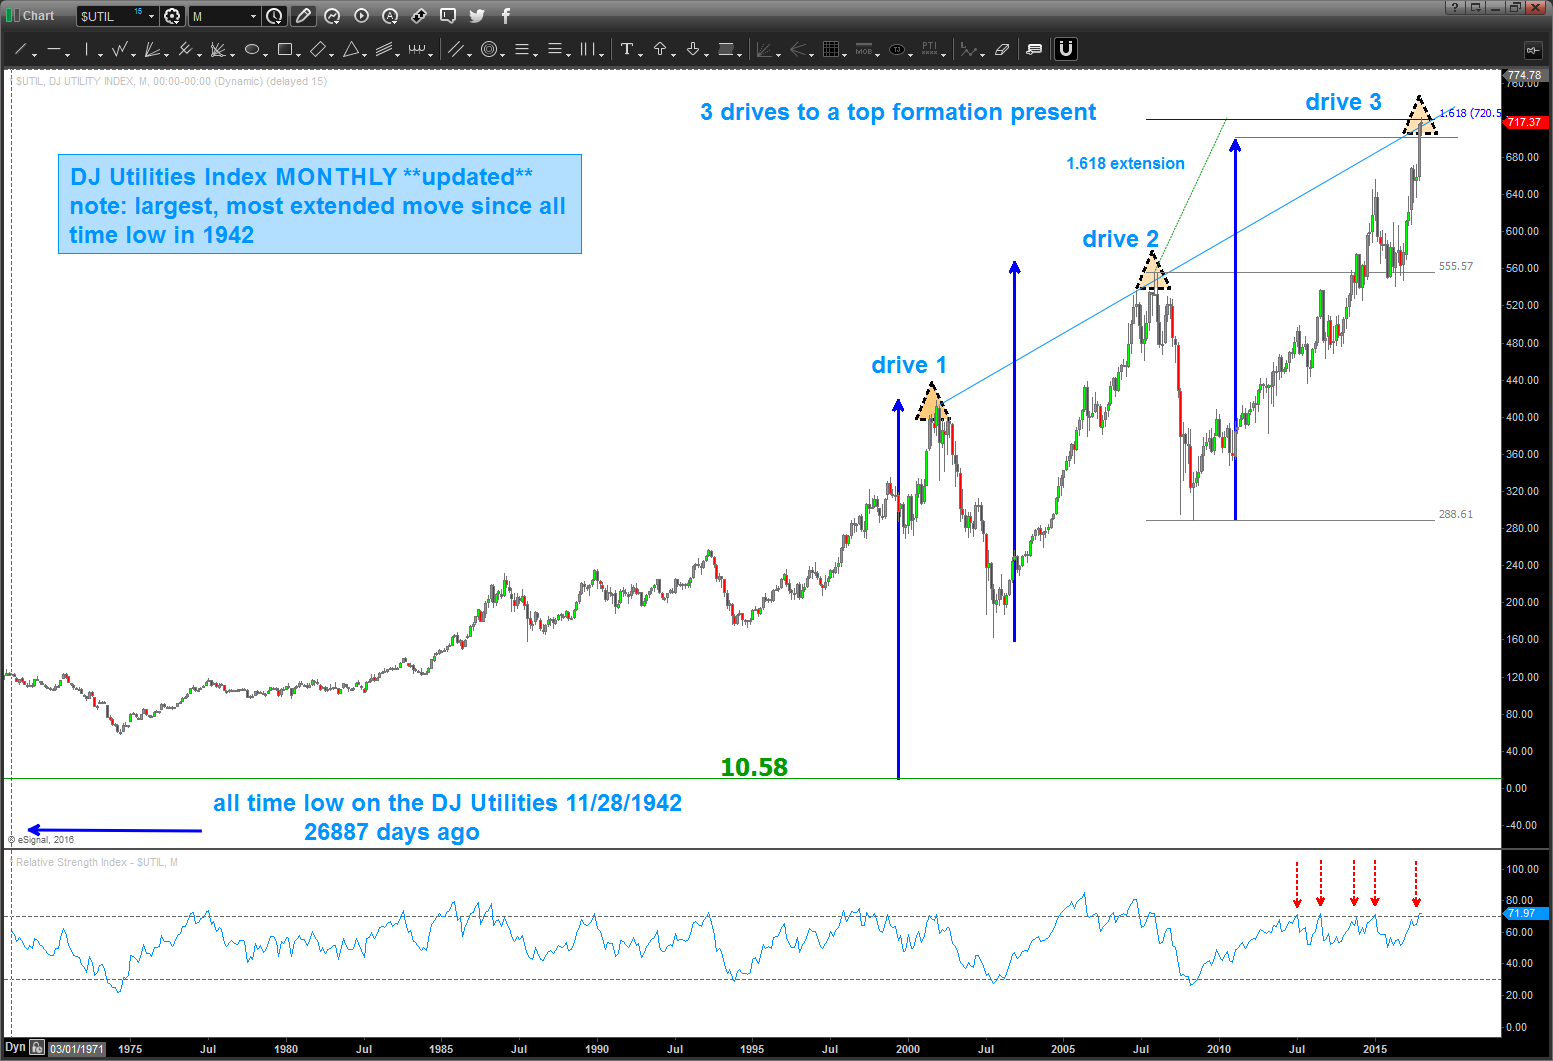
Additionally, please take note, the DJ Utilities Index is also completing a major run. In fact, It’s now exceeded any bull run since it’s low in 1942.
Dow Jones Utilities Chart
Yes, the fixed income market is extremely volatile right now and in the world of negative interest rates across the globe the search for yield and “safety” is real. I try not to pay attention to outside fundamental/news items and just look at the charts and the PATTERNS. Trade what you see, right? I see some very stretched and parabolic fixed income assets ready to produce a rising rate environment.
Trade safe and thanks for reading.
Twitter: @BartsCharts
Author does not have a position in mentioned securities at the time of publication. Any opinions expressed herein are solely those of the author, and do not in any way represent the views or opinions of any other person or entity.


