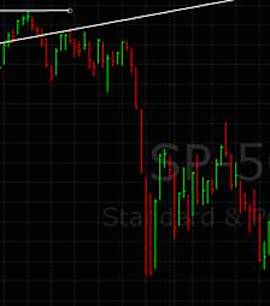
Almost a year ago I remember predicting that the S&P 500 Index (INDEXSP:.INX) would set lower lows before it reached higher highs. The S&P 500 hit an all-time high of 2132 back on July 20, 2015. As a result I had been moving out of stocks as we approached August 2015. That turned out to be prescient because the markets had a 14% plunge in August of 2015.
This is what the plunge looked like—a waterfall type event:
The market briefly recovered about half that loss then dropped back down to the lows in October 2015. Over the next few months the markets climbed back up to near its all-time high. Then, as we headed into 2016, the Federal Reserve announced it would be RAISING interest rates and it set off a market panic. The stock market collapsed from 2116 on November 3rd to 1810 on 2/11/2016. It was the worst start of a year EVER; A plunge of 14.5% over a 3 month period.
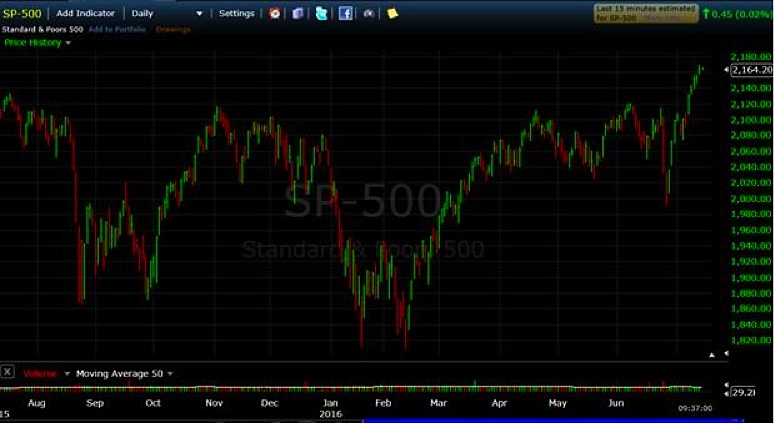
Since then the market has fought its way back to set a new all-time high on the S&P 500. For many retirees it has been a nauseating journey. Those fully or near-fully invested in S&P 500 the last year have been rewarded with a monstrous return of only 2.93% according to Google. Obviously, I doubt there are very many retirees that are fully invested in the S&P 500… but it wouldn’t surprise me if most major investment firms have retirees 60% allocated to stocks.
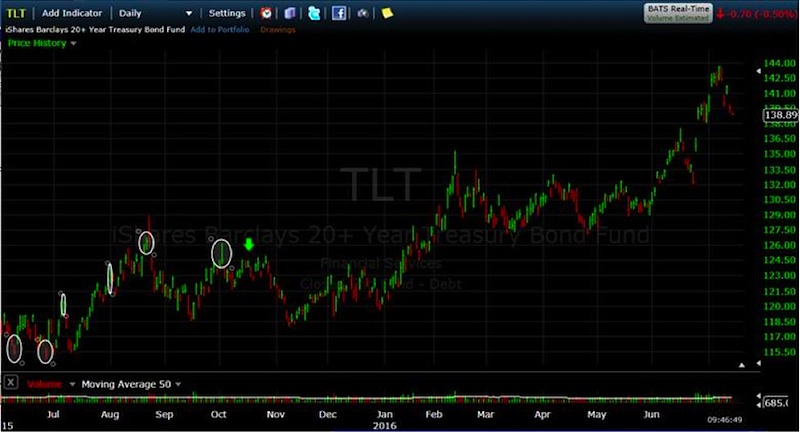
It has been a very different experience for those that avoided stocks and moved to the relative safety of US Treasury bonds and/or bond-like investments such as utilities or municipal bonds. Don’t get me wrong, the value of US Treasury bonds has fluctuated too. They had a hard time in the second quarter of 2015 and hit their lows around the same time that the S&P 500 was setting its then all-time high in July.
Here is the chart of the 20-year US Treasury bond ETF (NASDAQ:TLT) over the same time period as the SP500 chart above:
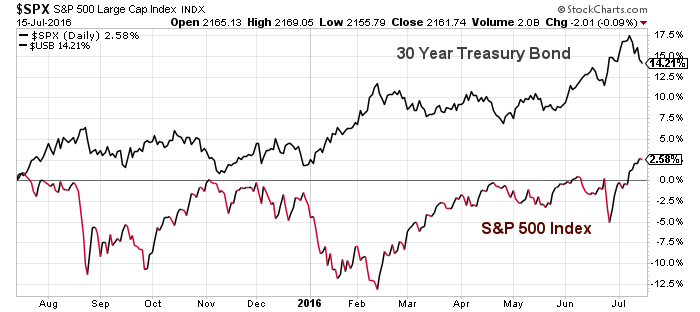
Here is a chart the 30-year US Treasury bond against the S&P 500 Index — it allows one to clearly see the performance difference between the two:
Over the last 12 months, those invested fully in the SP500 have a whopping return of +2.93% with most of that return coming in the recent market surge. The return of those in the SP500 was still negative at the end of June.
There have been ups and downs in UST bonds, too, but at least they have remained postitive throughout the year showing an overall gain according accoding to Google of 27.67%. Being invested in USTs the last year has been a good (if not great) call.
So where do we go from here? With stocks at all-time highs shouldn’t I be moving some money back into stocks?
I don’t know yet.
You see, there is still that darn Economic Cycle—you know the sine curve that shows periods of expansion, recession, depression then recovery? The Federal Reserve wants us to think that they have done away with the forces that cause the sine curve—human tendencies. But they haven’t. There may be a difference between the direction of the stock market and the economy but those dichotomies can be temporary. But over time, if the economy continues to slow (like it is globally and domestically) then it stands to reason that the probability of stocks out-performing bonds is possible but not probable.
I have been a bond bull for almost two years now and remain one still. My research continues on a daily basis and I reserve the freedom to change my mind as new information unfolds, but my focus isn’t on trying to be right every day (which is virtually impossible); it is to try to identify and participate in trends that can last weeks or months.
Thanks for reading.
Twitter: @JeffVoudrie
The author holds positions in mentioned securities at the time of publication. Any opinions expressed herein are solely those of the author, and do not in any way represent the views or opinions of any other person or entity.

 Ready To Break Out?")


 Rolling Over At Key Fibonacci Level?")