Apple’s stock price in 2015 was a lot like the broader market. It had highs, and it had lows… but at the end of the year, it went out showing weakness and putting in what amounts to an “annual” doji candlestick. That tells us a lot about the current state of Apple (AAPL)… at least from an investing perspective.
A “doji” star candlestick is a sign of indecision. This adds importance to the upcoming year. And that added layer of focus will likely usher in more volatility in 2016.
The Current State Of Apple (AAPL)
Apple (AAPL) began the year at 110.38 and finished the year at 105.26.
But it was a tale of two halves. Just as the Apple stock train got going in 2015, analysts and traders began chatter of price targets ranging from $150 on up. And that would mark a high water point in sentiment. Apple would eventually hit $134.54 and put in a broader topping pattern between February and July.
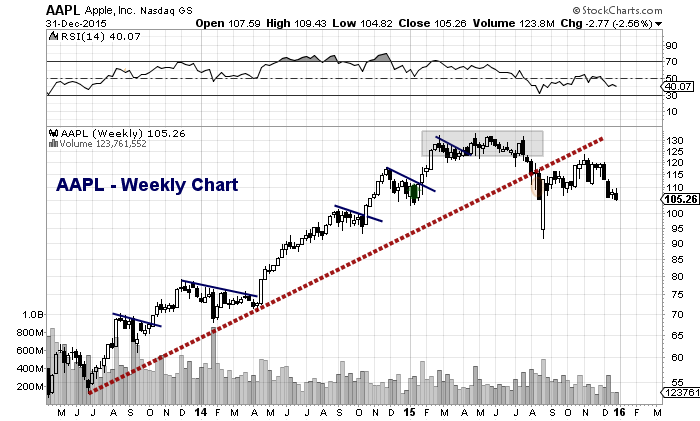
The key breakdown came in August when AAPL broke its intermediate trend line (see weekly chart below). I wrote about the consequences of Apple losing its up-trend line back in August. That breakdown would be the start of a decline all the way down to $92 (although the true depths of the decline were almost unbuyable as it only lasted for a few hours). In fact, the stock didn’t even close under $100 on a daily basis during the selloff.
But that said, AAPL also looks like it may want to retest its 2015 lows some time during the first half of 2016. That would likely come after a bounce to relieve its oversold state on the daily chart. With this in mind, it pays to know your time frames (trader vs investor).
Apple (AAPL) Weekly Stock Chart
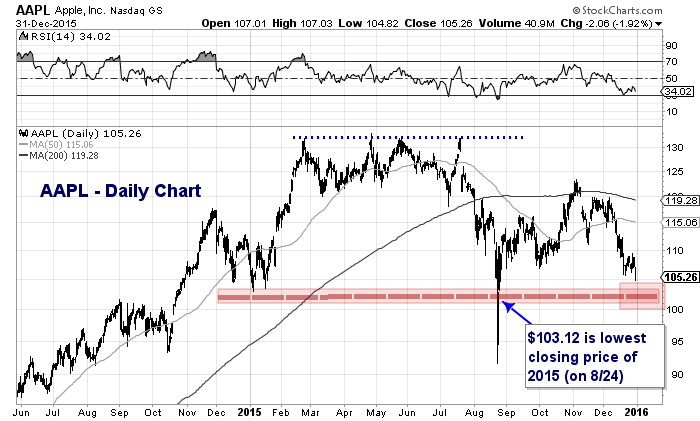
Apple (AAPL) Daily Stock Chart
Here’s a look at the near-term setup for Apple (AAPL). Many folks have cited the head and shoulders topping pattern that formed throughout 2015. To trigger, it would require a decline through $103 that holds. Regardless of patterns, the $103 level is an important price level on a closing basis as it marks the lowest close of 2015. A breach of this level would open up a retest of $92. So closing at $105, just 2 bucks off of its low close for 2015 highlights a bit weaker state of Apple than investors would like.
BUT, the stock is oversold on the daily chart and looks to be in line for a bounce soon (perhaps from the $100-$105 area).
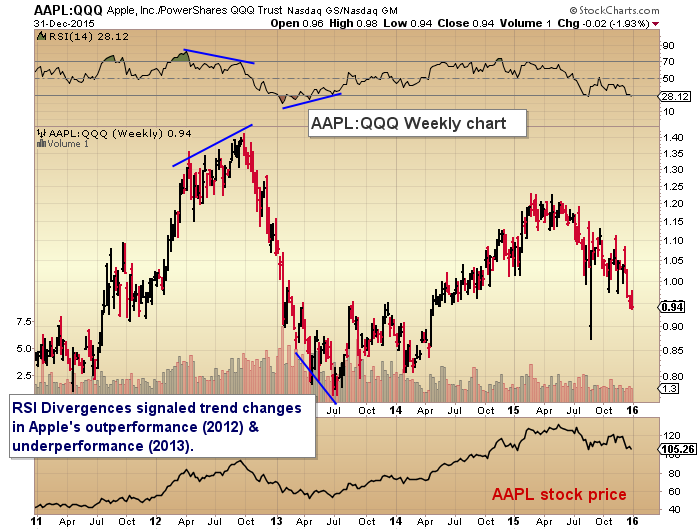
AAPL:QQQ Relative Performance Ratio Chart
One last thought: Apple is nearing oversold on a relative basis vs the PowerShares QQQ ETF. This appears to be supportive to a coming bounce. But at the same time, it speaks to the persistent weakness in Apple’s stock price over the last several months.
Apple still has a best in class portfolio of products with global reach. And there are statistics showing that Apple Pay could be huge for the tech juggernaut. Put Apple Pay on your radar, as it will likely play an important part in the continued success or failure of Apple’s growth story into 2016-2017. But for now, the state of Apple stock is neutral at best for investors, yet opportunistic for savvy traders.
Thank for reading.
Twitter: @andrewnyquist
The author does not have a position in any of the mentioned securities at the time of publication. Any opinions expressed herein are solely those of the author, and do not in any way represent the views or opinions of any other person or entity.


