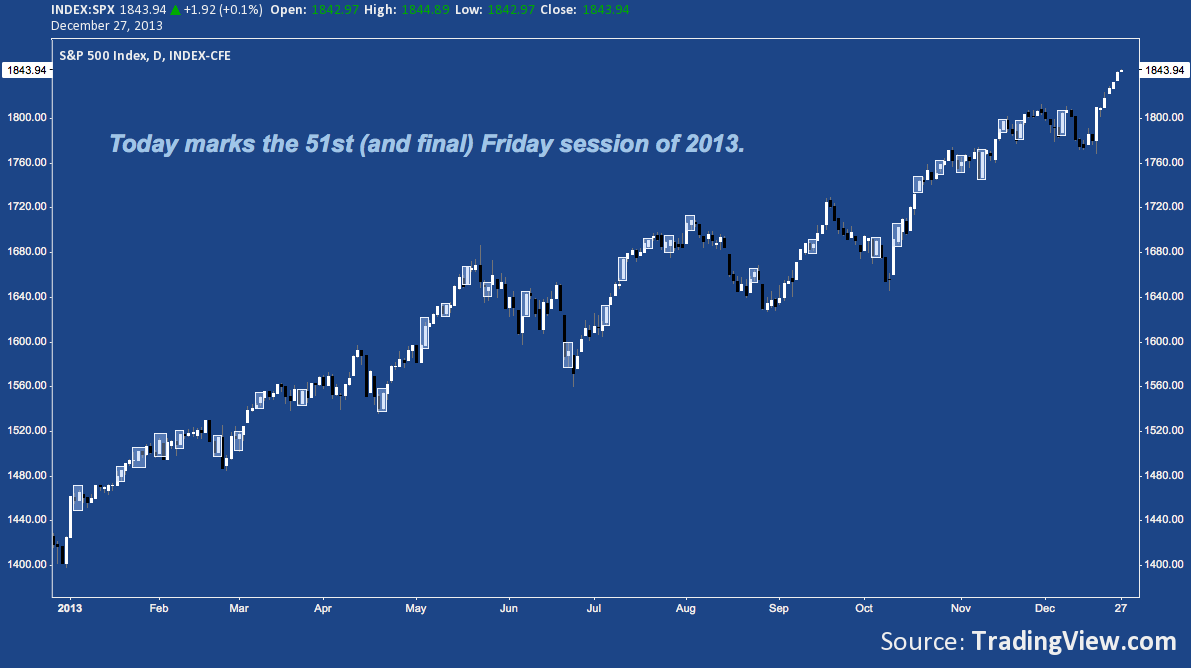
 Today’s session marks the 51st and final Friday of 2013, opening with the S&P 500 +29.2% (+416 points) year-to-date. Looking at a calendar-based cross-section of the S&P 500’s 2013 performance (as we did a couple weeks ago) , it turns out Friday has played a highly decisive role in its success.
Here’s an updated chart highlighting those Friday’s finishing up throughout the year. As you might guess, there’s quite a few of them:
Check out this rundown of S&P 500 Friday statistics of the preceding 50 Friday’s YTD on the S&P 500:
Up Fridays:
- Closed up 33 sessions, or 66% of the time
- Those 33 sessions added a cumulative 313.26 points
- The average gain of these 33 days is +0.55%
- The median gain on these 33 days is +0.45%
- The smallest gain: +0.17% (November 1, SPX finished +2.94)
- The largest gain: +1.27% (November 8, SPX finished +22.24)
Down Fridays:
- Closed down 17 sessions, or 34% of the time
- Those sessions shed a cumulative -97.16 points
- The average loss on these 17 days is –0.33%
- The median loss on these 17 days is -0.28%
- The smallest loss: -.00048% (January 11, SPX finished -0.07)
- The largest loss: -1.29% (May 31, SPX finished -21.39)
How did Up Fridays fare on their own?
- Up Fridays alone are responsible for 71.1% of the S&P 500’s YTD performance.
- Up Fridays (33) created 71.1% of the S&P 500’s net gain in 13.25% of YTD sessions (249).
What is Friday’s net performance YTD?
- Net of losses, Friday added 216 points, accounting for 51.8% of the S&P 500’s net 416 point YTD gain.
- Or net of losses, Friday is responsible for 51.8% of the S&P 500’s net gain in 22.6% of YTD sessions.
- Friday comprises 15.13% of SPX’s 29.2% YTD gain.
Looking at absolute figures tells an interesting story:
- Of 2013’s 1316.54 up points, Up Fridays contributed 23.8% of gross YTD gains.
- Up Fridays (33) account for 22.6% of 2013’s YTD up sessions (146).
These ‘up’ figures trend a bit higher but are roughly in-line with the 20% you’d expect Friday to contribute as 1/5 the trading week.
- Of 2013’s -900.71 down points, Down Fridays contributed 10.8% of gross YTD losses.
- Down Fridays (17) account for 16.5% of 2013’s YTD down sessions (103).
The ‘down’ figures, in contrast, show: 1) the incidence of red Fridays is somewhat low; and 2) the losing performance on those days is drastically lower: barely one-half the weight in losses one might expect Friday to pull as one of five trading days.
Viewed this way, Friday’s role in 2013 was more about understated losses when down days occurred then the infrequency of losing days. In other words, the S&P 500 Friday performance is, in part, the definition of “cutting losses short”.
As for the rest of the oft-quoted aphorism, the rest of 2013 (see the chart above) tells that tale well.
Twitter: @andrewunknown and @seeitmarket
Author holds no exposure to securities mentioned at the time of publication.
Any opinions expressed herein are solely those of the author, and do not in any way represent the views or opinions of any other person or entity.
 Rolling Over At Key Fibonacci Level?")


 Rolling Over At Key Fibonacci Level?")

