It’s been a wild summer thus far for the Shanghai Composite and Chinese stocks. After a sharp parabolic rally into June, China’s main stock index has fallen over 30 percent in just 6 weeks. And it may have more downside to come in 2015.
Here’s why. See the charts below for reference.
- The Shanghai Composite has been getting a lot of media attention due to some wild market moves. The crash lower will likely bring more awareness and emotion (i.e. “fear”) to the market.
- The index gained 157% from May 2014 to mid-June 2015.
- Anecdotal evidence of general public going “all-in” with outsized margin loans.
- “New Paradigm”.
- Chart exhibiting classic topping pattern (potential “bubble” top) as shown in the second chart below.
- If the recent low is broken, expect further declines as the public panics.
Shanghai Composite Index Chart
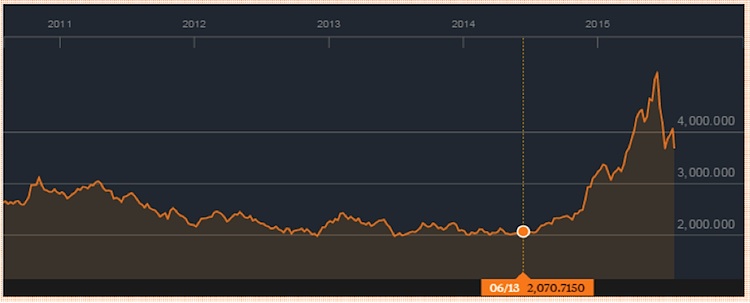
Bloomberg Charting
The Bubble Chart
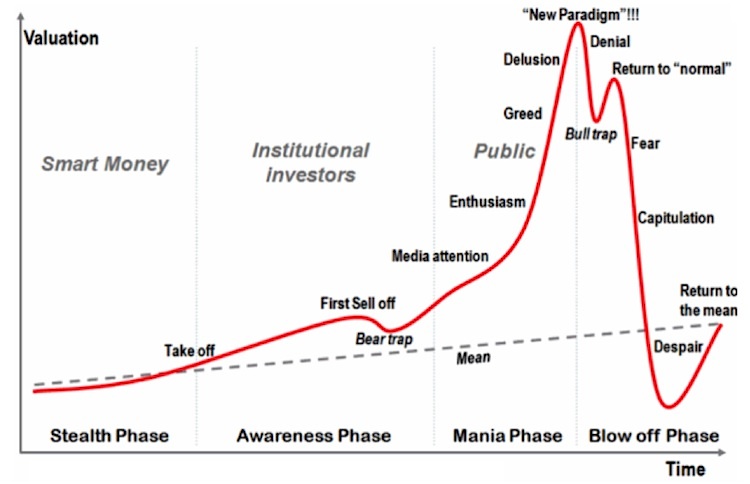
Chart source: Hofstra University’s Dr. Jean-Paul Rodrigue
Twitter: @OptiontradinIQ
No position in any of the mentioned securities at the time of publication. Any opinions expressed herein are solely those of the author, and do not in any way represent the views or opinions of any other person or entity.
 Rolling Over At Key Fibonacci Level?")


