Yesterday, we commemorated (if it can be called that) Bitcoin’s first break above $450 with a post over on Tumblr drawing comparison between its catapulting value and (what else?) the Dot-Com Bubble. Yes, things are really headed completely off the rails heating up over at Mt.Gox. Again.
The question we posed there:
Is Bitcoin’s value experiencing a speculative blow off?
Any question of what the phrase “speculative blow off” means is perhaps not surprisingly answered by Bitcoin itself:
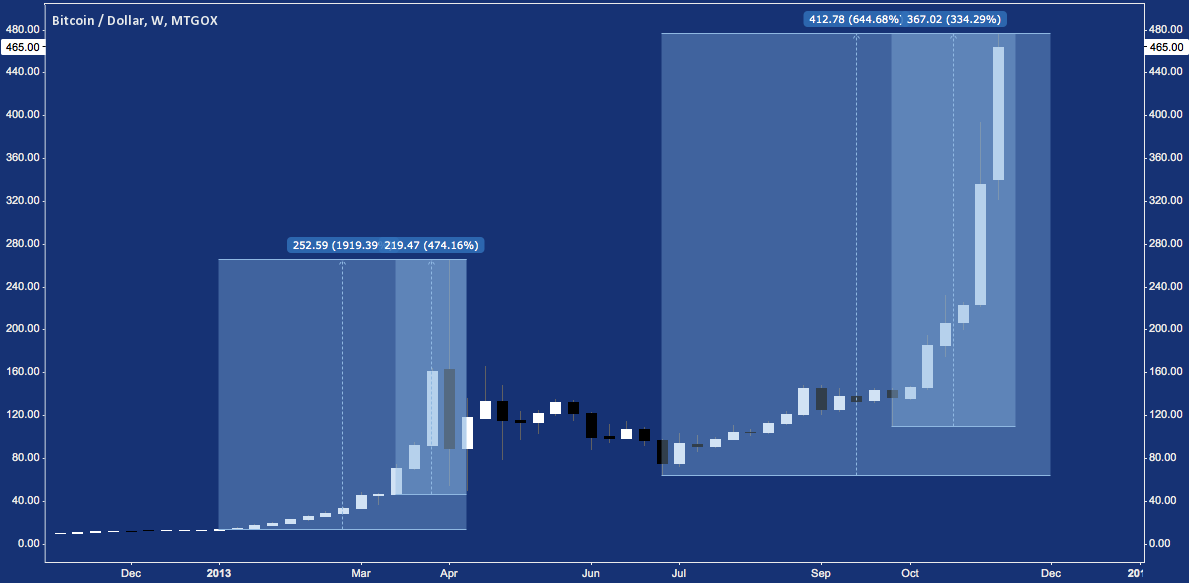
Bitcoin has traveled this path before. Between January and April 2013, BTCUSD (that’s the ticker symbol for Bitcoin expressed in US Dollars) rose nearly 2000%, and then gave back 81% of its entire value in 7 days.
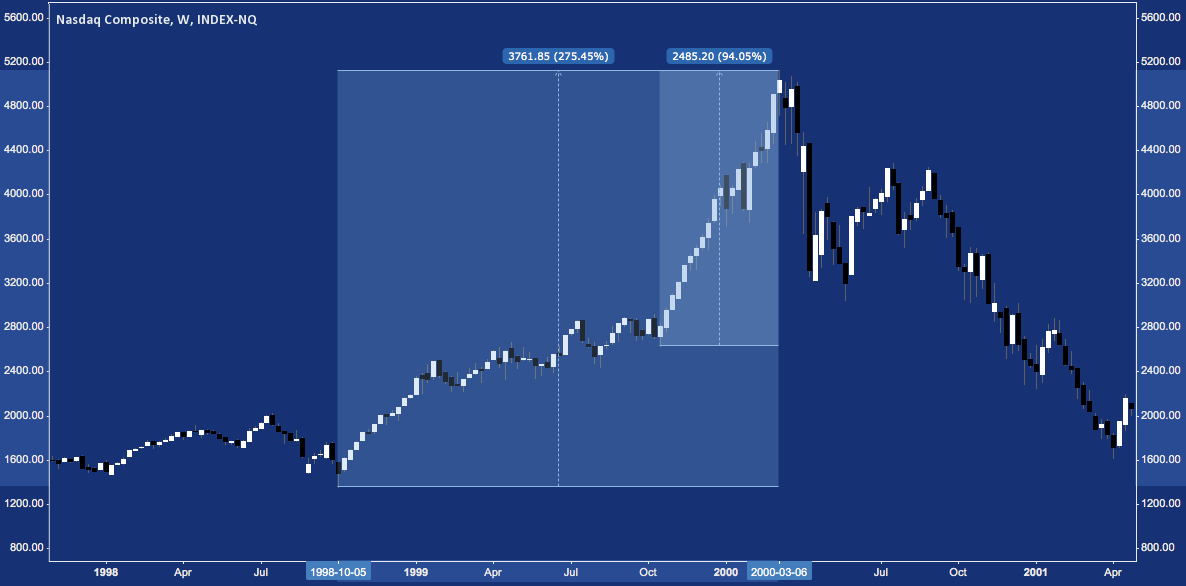
The tech bubble of the late Nineties – epitomized by the NASDAQ Composite‘s (COMPQ) unstoppable advance to 5132 in March 2000 – seems quaint by comparison:
The NASDAQ Composite knows a thing or two about bubbles and blow off phases. In 1998-2000 the tech-heavy index soared higher on the wax wings of absurdly-valuated, zero-profit, bing-IPO-ramped Internet companies, burning out only after adding 275% in 18 months (see chart below). Between October 1999-March 2000, the COMPQ tacked on +94%. This almost straight-line up was a manic buying episode that had entirely unraveled 6 months later. It easily stands as one of the best examples of a trend blow off phase in modern financial market history.
NASDAQ Composite (COMPQ) – Weekly: October 1998-March 2000 (click image to zoom)
Now compare that to what Bitcoin’s been up to lately:
-
+645% in 20 weeks.
-
+335% in 7 weeks.
Note COMPQ‘s timeline unfolds over months; BTCUSD has accomplished something far more impressive in roughly the same amount of weeks.
What you’re reading is true. Gone are the halcyon days (literally, we’re talking days here) of March 2013; since July, Bitcoin has only managed to squeak out a meager 645%.
Here they are, (confirmed) blow off #1 and (presumed) blow off #2:
Bitcoin (BTCUSD) – Weekly: 2013, (Two) Blow Off(s) (click image to zoom)
Does it seem a little early to sound the warning bell? Look again: with its range and rate of change, the entire year has been a warning bell.
Don’t skip over this point: a decline comparable to April’s in BTCUSD would take it back below $100 from its present lofty perch above $450.
Not possible? Tell that to the guy who bought at $266 on April 8, only to watch his position dwindle to a closing price of $68.36 on April 15.
Naked speculation like this isn’t about the fundamentals of the underlying instrument; it’s about too many too casually entering a position, hoping they aren’t the greatest fool among the greater fools with whom they stand shoulder to shoulder, pouring US Dollars into a digital currency that has risen at a rate of 48% per week over the last 7 weeks.
You don’t need to know the top in BTCUSD to understand the dynamic that has brought it so far, so fast from the bottom.
Just compare COMPQ and BTCUSD: entirely different asset classes, to be sure – but it’s the same fallible human propensity for mania driving them up. With one look at the historic lesson of the former, you can tell the latter is venturing down a bad road – again.
Check out the full post here.
Twitter: @andrewunknown and @seeitmarket
Author holds no exposure to securities mentioned at the time of publication.
Any opinions expressed herein are solely those of the author, and do not in any way represent the views or opinions of any other person or entity.


 Rolling Over At Key Fibonacci Level?")
